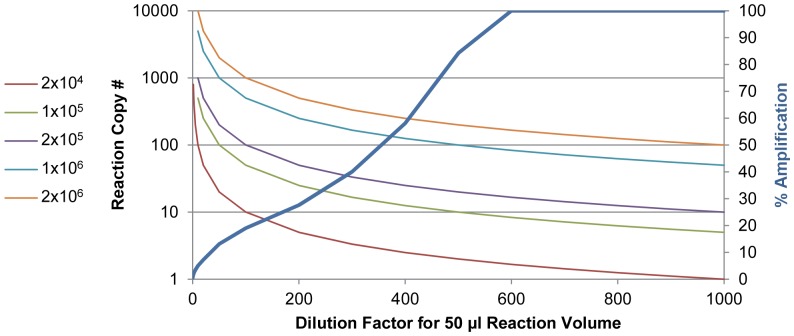
Figure 3. Model describing low copy number non-detection for dilutive methods.
The right hand Y-axis (% amplification) shows the increase in amplification associated with dilution of inhibitors from a fecal sample. A range of starting target concentrations (CFU/gram) is plotted with the left hand Y-axis showing the copy number present in a 50 µl reaction volume (Illumigene). The reduced inhibition and increasing % amplification with increasing dilution is concomitant with a reduction in copy number. At lower CFU/gram samples, the dilution places the copy number per reaction beneath the sensitivity of the assay. HE-LAMP-BART used a 50 fold dilution together with the inhibitor removal such that a higher copy number can be present in the reaction.

