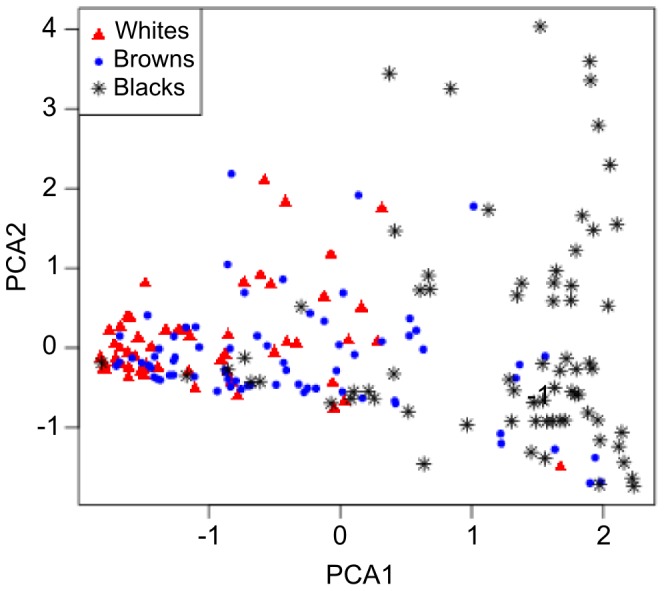
Figure 4. Bi-plot of principal component 1 (PC1) vs. principal component 2 (PC2), with the three color groups shown in different colors and symbols.

Each point represents one individual, self-assessed as Whites (red triangles), Browns (blue dots) and Blacks (black asterisks). We ran the Principal Component Analysis (PCA) using three variables: Pigmentation Index (PI), African ancestry and Amerindian ancestry. The PCA and the plot were done using R program, v. 3.0.0 [51].
