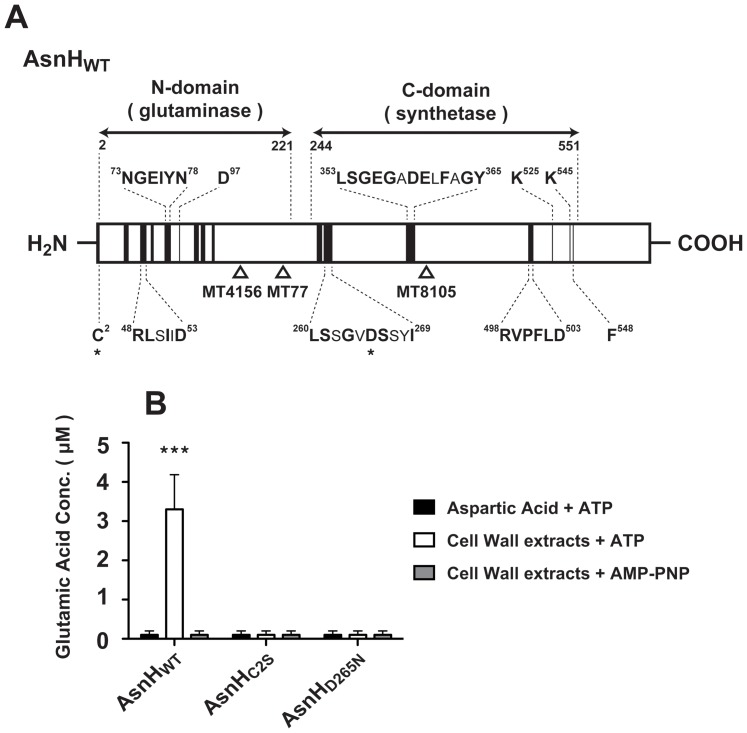
Figure 3. Schematic diagram of L. casei AsnH and glutaminase activity of AsnH proteins.
(A) Protein sequence alignment was performed using the GENETYX program. Solid boxes indicate highly conserved regions. Regions containing residues important for enzymatic activities are shown in detail (identical residues are indicated by boldface type). The first methionine was consistently included in the numbering and was designated Met-1. Asterisks indicate mutated residues in this study that were critical to glutaminase or synthetase activities. (B) Recombinant AsnHWT, mutant AsnHC2S, and mutant AsnHD265N (0.1 µg) were examined using the glutaminase activity test. Five microliters of a reaction mixture (initial volume, 50 µl) were quenched at 30 min to estimate glutamic acid concentration. Glutaminase activity was monitored in the presence of aspartic acid or cell wall extracts of ATCC 27139, ATP or AMP–PNP plus cell wall extracts. Results are depicted as the means ± standard deviations (SD). Statistical significance was calculated using the Student's t-test. Significant differences indicated between the control and treated groups. ***, p<0.001.

