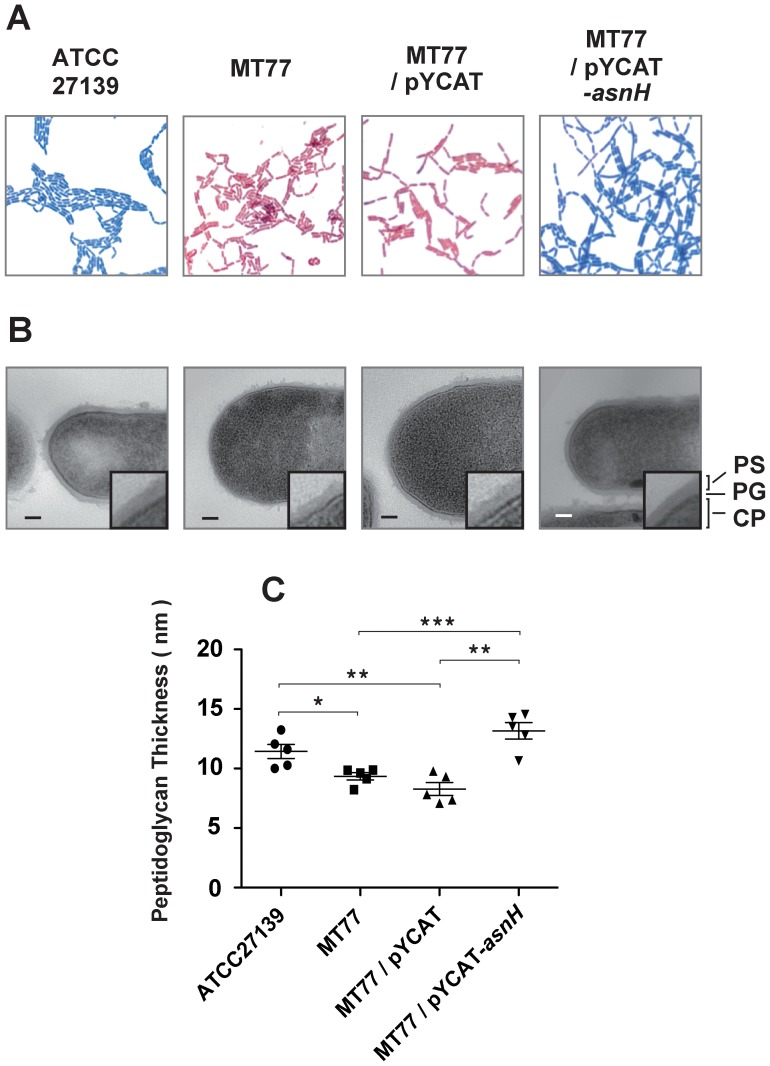
Figure 4. Micrographs of L. casei cells.
(A) Gram staining was performed using Fiber G. The cells were observed under a light microscope (×1000). (B) Representative micrographs indicating cell morphologies in several different fields. Digitally magnified (×3) views of typical cell surfaces are shown in the insets. Scale bars = 100 nm. PS, polysaccharide; PG, peptidoglycan; CP, cytoplasm. (C) Peptidoglycan thickness of L. casei cells are presented as the means ± standard error of the mean (SEM) (n = 5). Statistical significance was calculated using the Student's t-test. *, p<0.05; **, p<0.01; ***, p<0.001.

