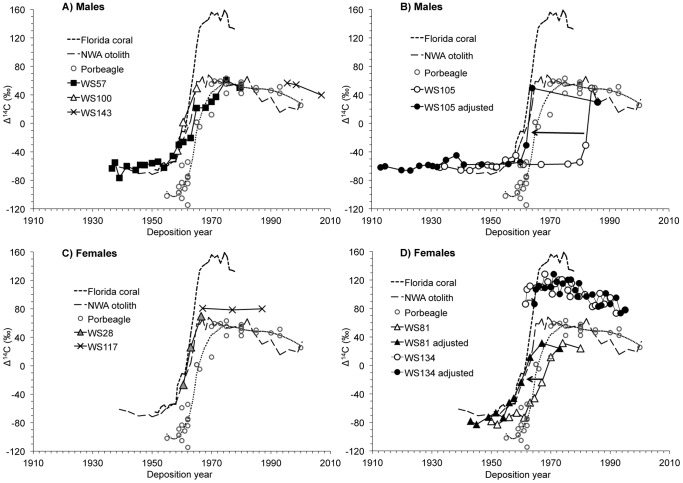
Figure 2. White shark Δ14C results compared to three Δ14C reference chronologies [11], [31], [32].
Results from male (A, B) and female (C, D) white shark vertebrae. Dotted line is porbeagle data smoothed with a Loess curve. For panels B and D, the arrows indicates the vertebral Δ14C curves that had to be shifted to line up with the reference chronologies (white open symbols are initial data, black symbols are data shifted to align with the references).

