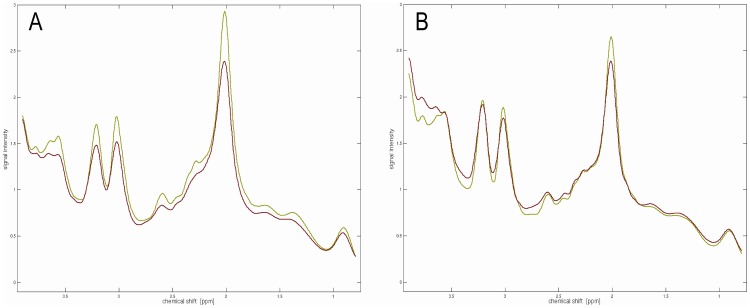
Figure 3. Averaged spectra from the rostral (A) and caudal (B) SN regions of PD patients (red) and controls (green).
Beside significant differences in the signal intensities of the three main metabolites NAA, creatine, and choline between both groups, there are clear differences in the range from 2.1 to 2.9

