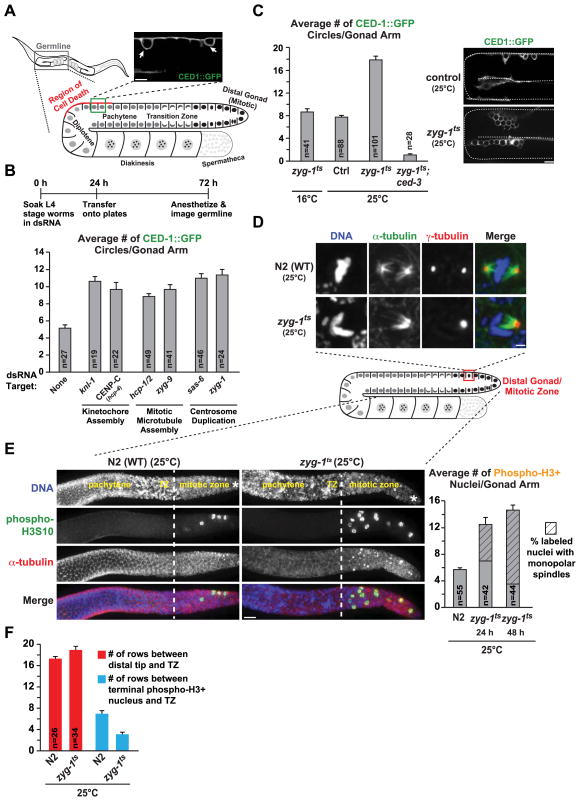
Figure 1. Perturbation of mitosis in the germline results in an increase in cell death.
(A) Gonad schematic and representative image of nuclei undergoing programmed cell death marked by CED-1::GFP (arrows). Bar, 5 μm.
(B) Quantification of cell death for the indicated conditions; experimental scheme is above the graph. Error bars are SEM; unpaired t tests show significant difference (p<0.001) between control and each individual inhibition.
(C) Quantification of cell death in zyg-1ts worms and example images. Worms were analyzed at the following times: zyg-1ts;ced-3, 24h after upshift; zyg-1ts at 16°C, adults age-matched to 24h at 25°C; control and zyg-1ts at 25°C the compiled average from 24, 36 and 48h post upshift (see Fig. S1A). Error bars are SEM; control and zyg-1ts at 25°C are significantly different (p<0.0001; unpaired t-test). Bar, 10 μm.
(D) Immunofluorescence images of the mitotic zone of extruded gonads labeled for DNA, α-tubulin and γ-tubulin 24h post upshift; partial z stack projections. Bar, 2 μm.
(E) Images and quantification of phospho-H3S10 positive nuclei in gonads 24h post upshift; the prevalence of monopolar spindles in the labeled nuclei is also plotted. Errors bars are SEM. Asterisk denotes the distal end of the gonad, dotted white line denotes the end of the mitotic zone/beginning of the transition zone, based on nuclear morphology. Bar, 10 μm.
(F) Quantification of the data presented in (E). Error bars are SEM; unpaired t test shows no significant difference (p=0.062) in the size of the TZ but a significant difference (p<0.0001) in the distance between the last phospho-H3 positive nucleus and the TZ.
(See also Figures S1 & S2).

