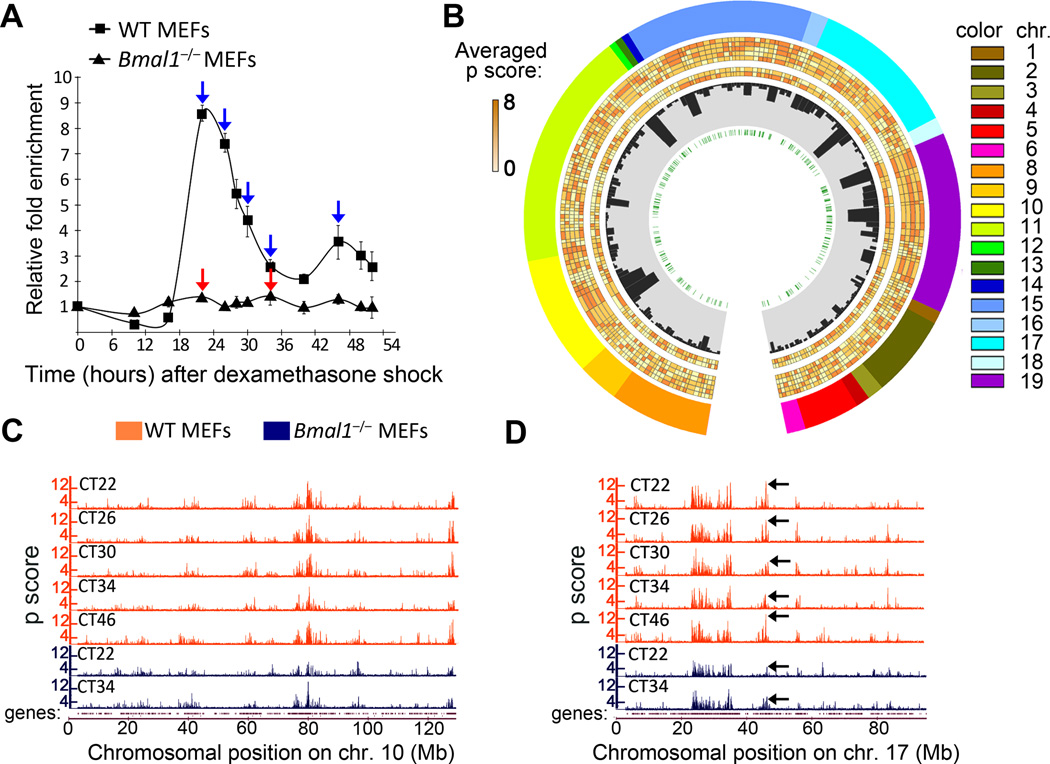
Figure 1. Characterization of genomic long-range interactions during the circadian cycle.
A, Dbp expression profile in wild type (WT) and Bmal1−/− MEFs after dexamethasone synchronization was analyzed by quantitative RT-PCR. Time 0 value was set to 1. Data were normalized to β-actin, and are represented as average and s.e.m. of three independent biological replicates. Blue and red arrows indicate the circadian times (CT) in which wild type (WT) and Bmal1−/− cells were harvested for 4C analysis. B, Circos plot representing the Dbp interactome. The layers indicate, from the outside to the inside: chromosome, number is indicated as a color code and length is proportional to the actual length of the interacting regions; averaged p scores for each genomic region shown as a color scale; histogram bars representing the gene content for each region; E-box elements location. The averaged p scores correspond to each 4C experiment, from the outside to the inside: WT CT22, WT CT26, WT CT30, WT CT34 and WT CT46, Bmal1−/− CT22 and Bmal1−/− CT34. C and D, microarray profiles showing the interaction frequencies (p score from the 4C data) between Dbp and mouse chromosomes 10 (C) and 17 (D). Orange and blue plots represent the data for wild type (WT) and Bmal1−/− MEFs respectively. The corresponding circadian time (CT) is indicated for each lane. The datasets are highly correlated, but major differences in the interaction frequencies become apparent (black arrows on plots in D). The genomic position in mm8 coordinates is indicated on the horizontal axis. The profiles for the rest of the chromosomes are provided in Supplementary Figure 3.

