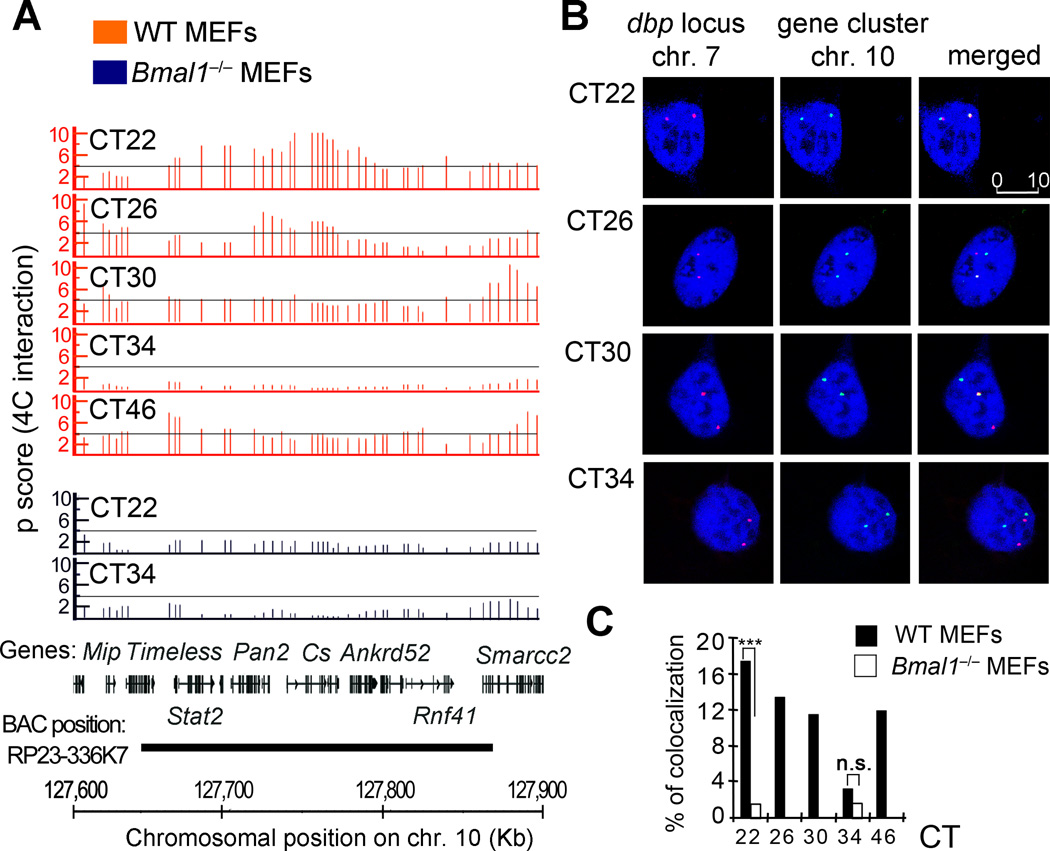
Figure 3. FISH validation of 4C data.
A, 4C microarray profiles for a selected region on chromosome 10, showing the running mean enrichments of 4C signal over genomic signal for 100-kilobases windows (p scores). Threshold (p score = 4) is indicated as a grey line. The corresponding circadian time (CT) after dexamethasone synchronization, is indicated on the top right for each plot. Orange plots represent data for wild type (WT) MEFs, and the data corresponding to Bmal1−/− MEFs is shown in the blue plots. The gene position and the genomic location in mm8 coordinates for all the plots are indicated at the bottom of the figure. The region covered by the BAC used as a probe for this experiment is also indicated. B, representative double label DNA FISH for Dbp locus on chromosome 7 (red) and the selected region on chromosome 10 (green). DNA was counterstained with DRAQ5 (blue). Representative picture shots correspond to wild type MEFs synchronized with dexamethasone, and fixed for FISH analysis at the indicated hours after synchronization (circadian time, CT). 280 to 350 nuclei were analyzed for each time point and genotype using three biological replicates. The scale bar in µm is indicated in the top right panel. C, bar chart showing the interchromosomal interaction frequencies between Dbp and the selected gene cluster on chromosome 10. Dexamethasone synchronized wild type (WT) and Bmal1−/− MEFs were fixed at the indicated CTs for further DNA FISH analysis. Data is represented as a percentage of colocalization based on overlapping events of the green (chromosome 10 locus) and red (Dbp locus on chromosome 7) FISH probes from a total of 280–350 cell nuclei at each condition from three biological replicates. ***P <0.001; n.s. non-significant (P>0.05), Two tailed Fisher exact test.

