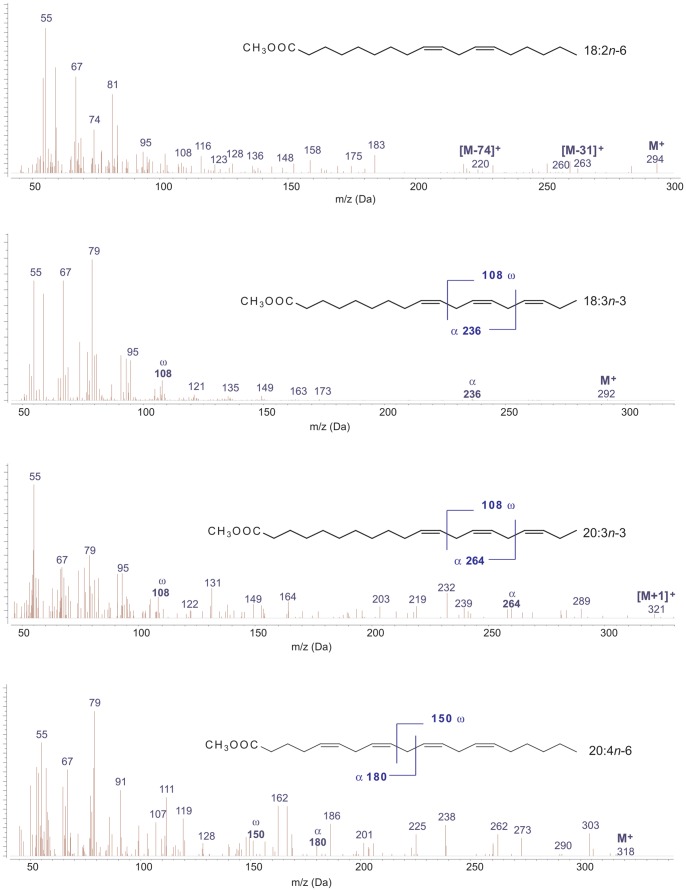
Figure 3. Selection of mass spectra of polyunsaturated fatty acids methyl esters.
The typical ω fragmentation peaks at m/z 108 due to n-3 terminal groups, as well as the α fragments (at m/z 236 for 18∶3n-3, m/z 264 for 20∶3n-3, and m/z 180 for 20∶4n-6) are clearly seen. Note that the methyl group is a consequence of the derivatization, and was not present in the original sample.

