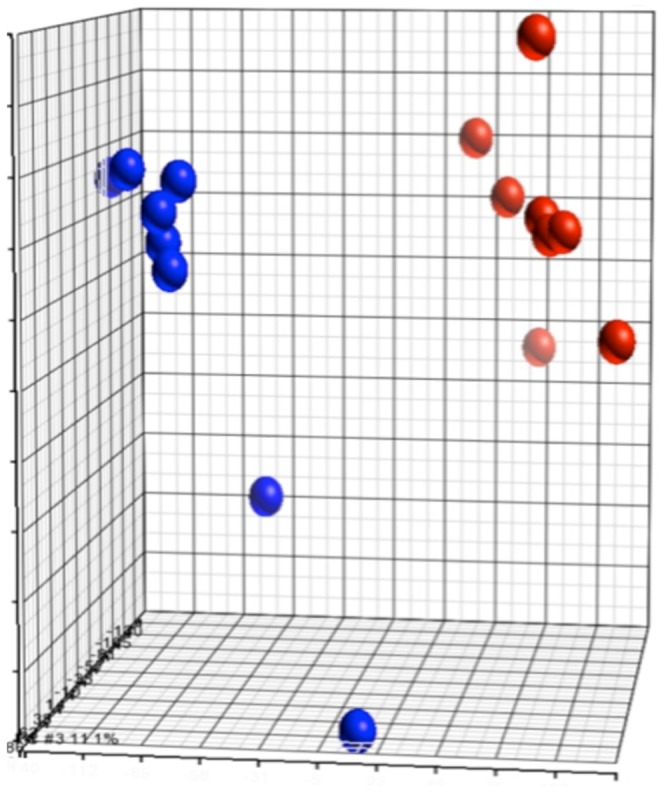
Figure 7. Principal component analysis (PCA) of transcriptomic data of wild-type versus Rsk2-/Y mandibular molars samples.

Wild-type samples are represented as red balls, whereas mutant samples are represented in blue (X, Y and Z units are arbitrary units created by the software). The units are data-dependent and are generated by the software, which gives coordinates to each sample according to three axes that relate to the weight (inertia) of the decomposition into 3 principal components. For this analysis, samples segregate in two distinct groups, showing relevant transcriptional differences between WT and Rsk2-/Y samples.
