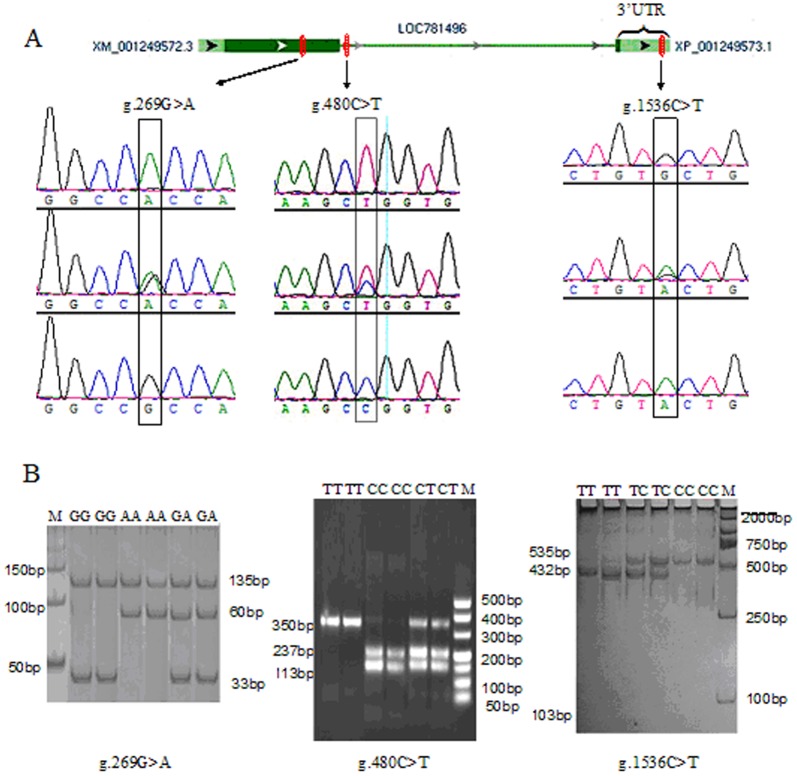
Figure 1. TNP2 gene structure, SNP location, sequencing results, and band patterns of genotypes g.269G>A, g.480C>T, and g.1536C>T.
Part A shows the bovine TNP2 gene structure, location, and SNP sequencing results. The green region represents the exon and blue region represents the untranslated region (UTR). B: Silver-stained gels showing the band patterns of SNPs g.269G>A, g.480C>T, and g.1536C>T digested with HpaII and HindIII. HpaII digestion of the PCR products of the TNP2 g.269G>A locus produced 135, 33, and 27 bp bands for the GG genotype; 135, 60, 33, and 27 bp bands for the GA genotype; 135 and 60 bp bands for the AA genotype. HpaII digestion of the PCR products of the TNP2 g.480C>T locus resulted in a 350 bp band for the TT genotype; 350, 237, and 113 bp bands for the CT genotype; 237 and 113 bp bands for the CC genotype. HindIII digestion of the PCR products of the TNP2 g.1536 C>T locus generated 432 and 103 bp bands for the TT genotype; 535, 432, and 103 bp bands for the TC genotype; a 535 bp band for the CC genotype.

