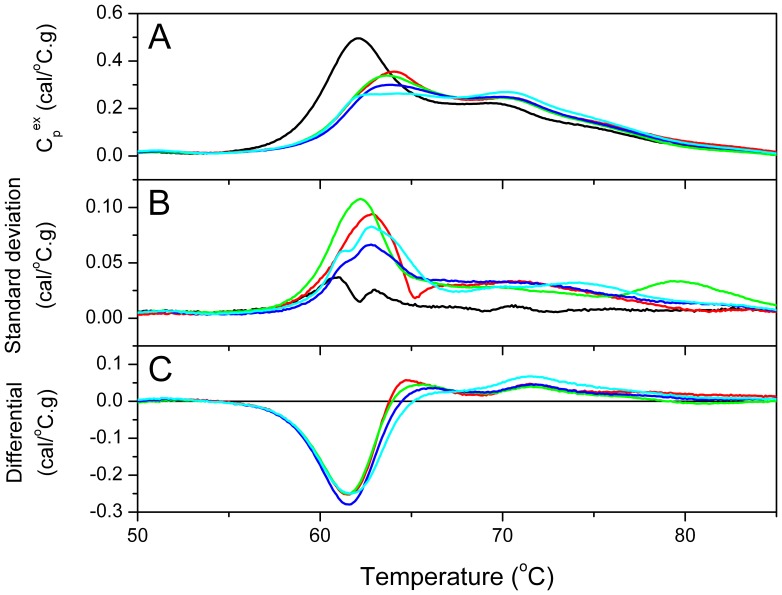
Figure 1. Thermogram profiles associated with progressive cervical disease.
Mean thermogram profiles of excess specific heat capacity (Cp ex) versus temperature (Panel A) and standard deviation (Panel B) of each clinical group: controls (black); LSIL (red); HSIL (green); early stage IC [FIGO Stage I] (blue); and advanced IC [FIGO Stage II-IV] (cyan). Thermograms show a progressive shift towards higher denaturation temperatures with increasing disease burden. Difference plots of clinical group thermograms compared to the control group (Panel C) show negative difference peaks ∼62°C and increasing shift and magnitude of higher temperature positive difference peaks. These are hypothesized to reflect the interaction of disease specific components with abundant plasma proteins, principally albumin, with resultant thermal stabilization and alteration of plasma thermogram profiles.

