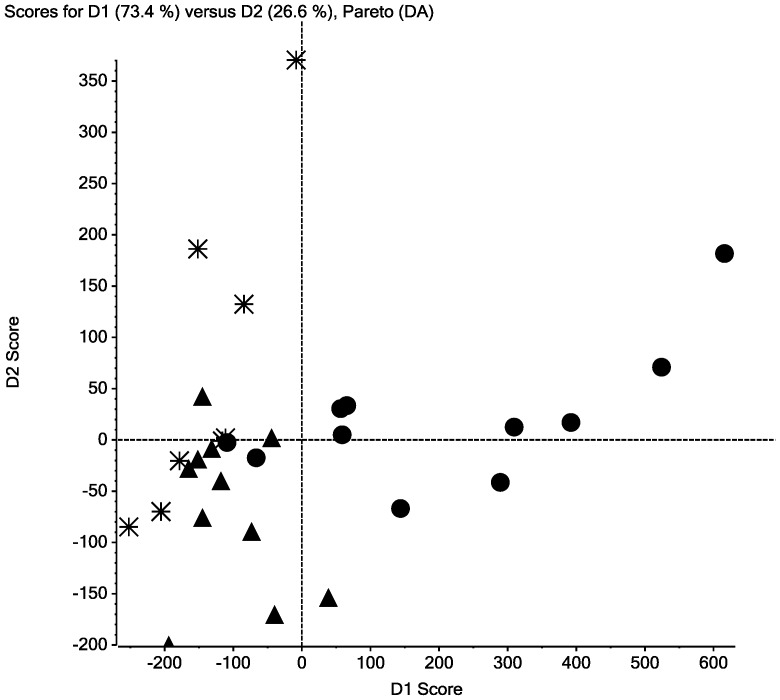
Figure 4. Discriminate principal components analysis (dPCA) of MALDI-TOF MS peptidomic data.
MALDI-TOF MS spectra were aligned and binned using Markerview software version 1.2 (Applied Biosystems, Framingham, MA) and analyzed using discriminant Principal Component Analysis (dPCA). The top two principal components from the dPCA analysis of MALDI-TOF MS data for peptides released following precipitation of plasma proteins by addition of acetonitrile/acetic acid. (FX2; Fraction 2) sort cervical cancer (asterisks), CIN 2 (triangles) and control cervix (circles) plasma samples into discriminate groups.

