
Figure 5. Distributions of fractions of the rf-SDRs in active site residues (ASRs, A) and ligand binding residues (LBRs, B), observed in the superfamilies with low, medium and high degrees of functional diversity classified at the third-digit level of EC numbers.
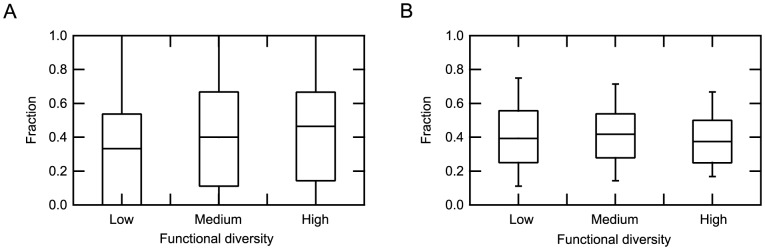
The top and bottom of a box indicate 75th and 25th percentiles and the horizontal line in a box represents the median value. The top and bottom whiskers represent 90th and 10th percentiles.