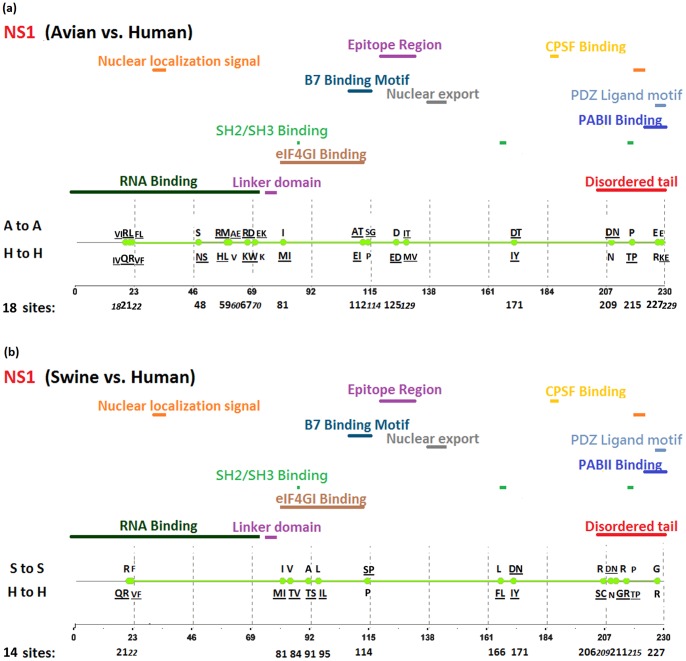
Figure 8. Genomic signatures in NS1: (a) avian vs. human (b) swine vs. human.
Green circles denote the signatures in the NS1 sequence, with their positions shown on the bottom line. The dominant amino acid residues of the signatures are placed above (A to A or S to S) and under (H to H) the circles. The color lines indicate the functional, structural, or epitopic domains mapped by the signatures.

