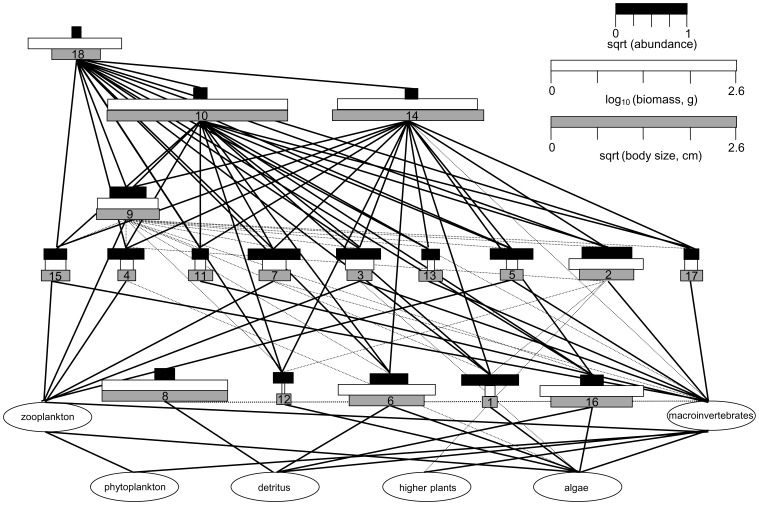
Figure 1. Expected food web for 18 fish species based on known trophic relationships (see Table S1).
The width of black, white, and gray bars for each fish species (nodes) represent square root abundance, log10 mean biomass of individuals (g), and the square root mean body size (cm) of individuals from community sampling data, respectively. The number for each species is its ordered sum rank abundance (Appendix S1).

