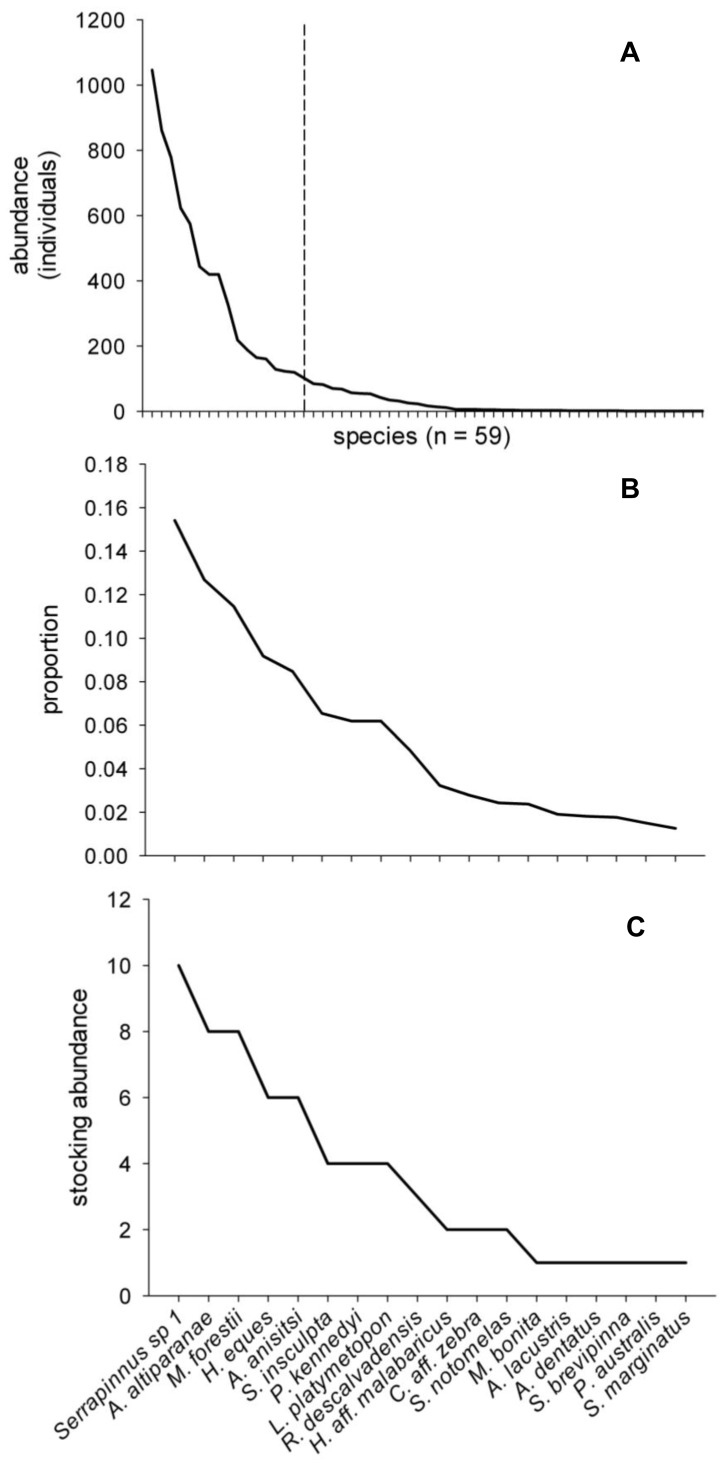
Figure 2. Rank abundance curve and example of stocking abundances.
A) Rank abundance curve of 59 fish species derived from community sampling data from isolated lagoons (n = 11) in the Upper Paraná River floodplain during austral spring from 2000–2007. Species to the left of the dashed line represent the pool of species (n = 18) used in the experiment. B) Proportional rank abundance curve of the 18 species from (A) that provides the basis for experiment stocking abundances. C) Example of stocking abundances for the 18 species richness treatment (total 65 individuals per mesocosm).

