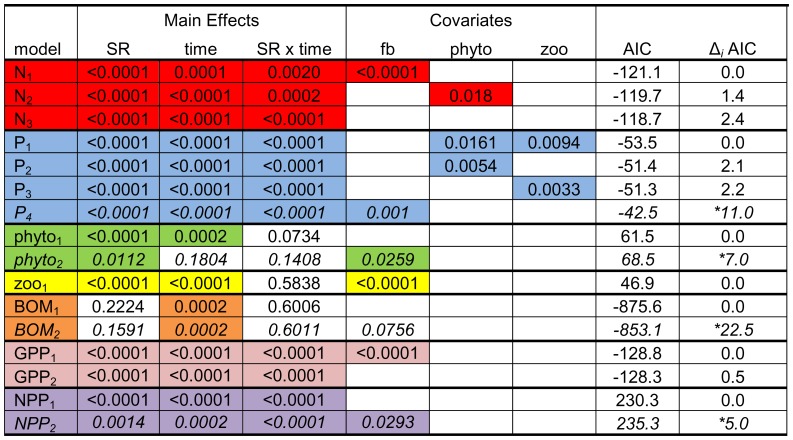
Figure 4. Best fitting models for each response variable calculated using mixed model, repeated measures ANOVA.
Models investigated direct trophic interactions using every possible covariate combination as well as the effect of fish biomass (treatment covariate). Each row represents an individual model with response variables grouped by color (red = nitrogen, blue = phosphorus, green = phytoplankton, yellow = zooplankton, orange = benthic organic matter, pink = GPP, purple = NPP). For a given response variable, models are ranked by goodness of fit according to Δi AIC value. P-values for the main effects (SR = species richness) and covariate(s) (fb = total fish biomass, phyto = phytoplankton, zoo = zooplankton) from ANOVA models are given within cells and shaded cells represent significant results (α = 0.05; full ANOVA results given in Table S3). Only models with Δi AIC <3 are shown, except that models where fish biomass exceeded the <3 Δi AIC threshold are still presented and denoted in italics and * next to Δi AIC value. As GPP and NPP are composite measures of whole ecosystem processes, direct trophic interaction covariate models were not explored.

