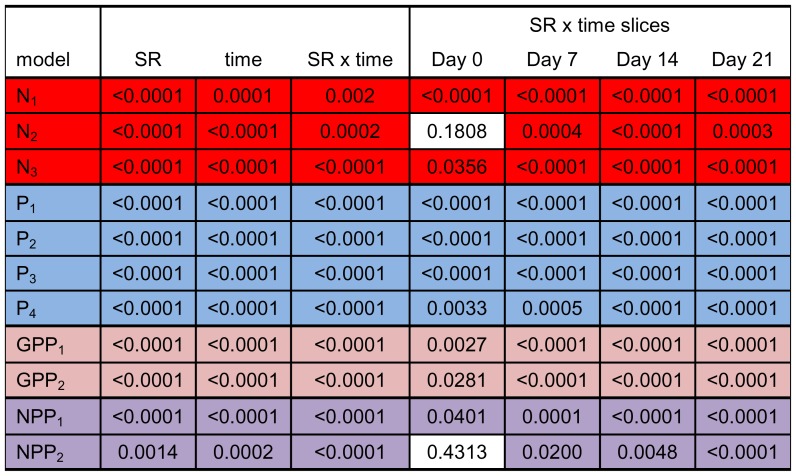
Figure 6. Slice effects for best fitting models for each response variable.
Each row represents an individual model when a significant species richness (SR) by time interaction was observed with response variables grouped by color (red = nitrogen, blue = phosphorus, pink = GPP, purple = NPP). P-values for the main effects and time steps from ANOVA models are given within cells and shaded cells represent significant results (α = 0.05; full ANOVA results are provided in Table S3).

