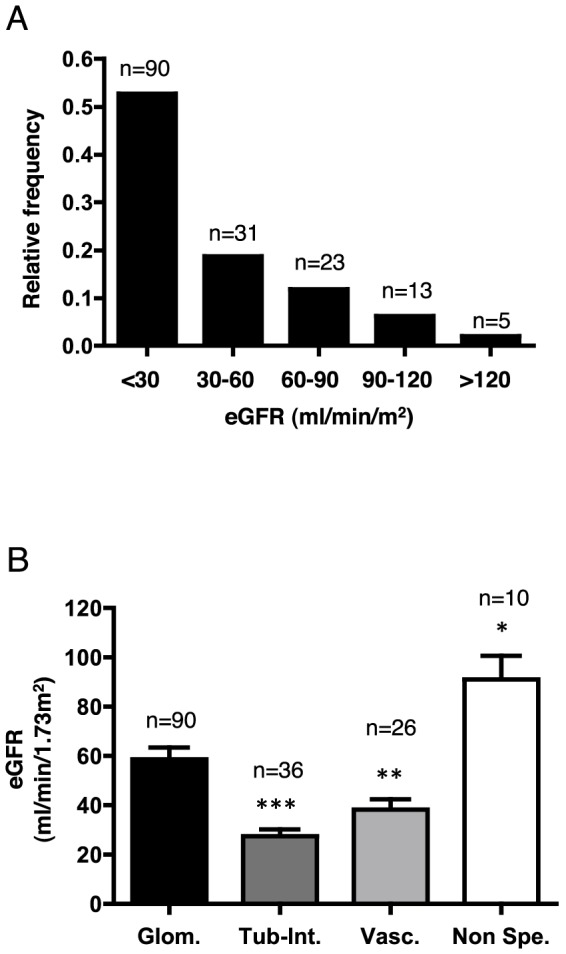
Figure 1. Distribution of estimated glomerular filtration rates.

A. Histogram showing the distribution of the study population according to the eGFR level at inclusion. B. Histogram showing eGFR values according to the type of kidney disease. eGFR is expressed as the mean ± sem. *p<0.05, **p<0.01, ***p<0.001 compared to glomerular disease using Student's T test; the Mann-Whitney test was used for the glomerular vs. comparison with non-specific lesions. Glom: glomerular diseases; Tub-Int: tubular and/or interstitial diseases; Vasc: vascular diseases; Non-spe: non-specific.
