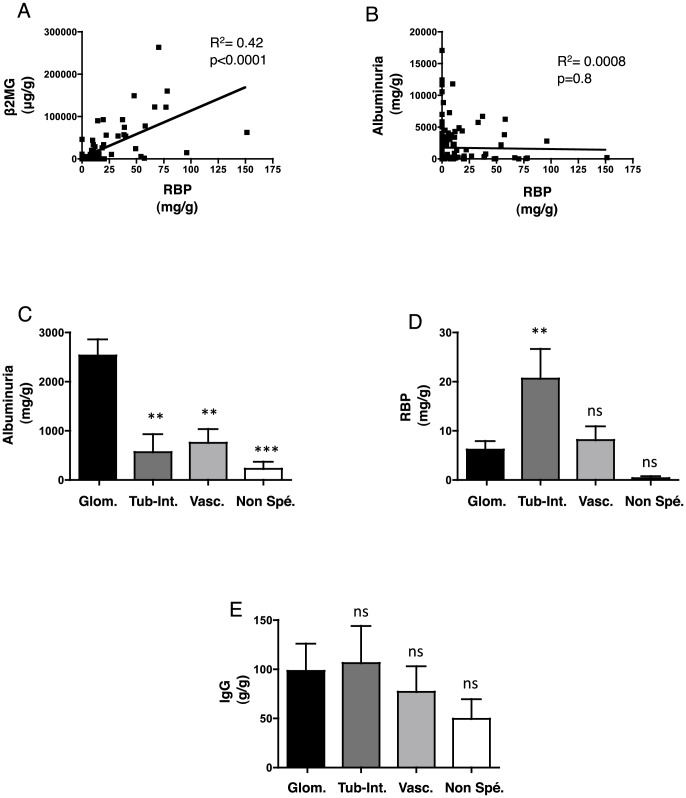
Figure 2. Expression patterns of proteinuria.
A, B. Best-fit slope of the linear regression between RBP and β2MG (A) and RBP and Alb (B). C, D, E. Histogram showing Alb (A), RBP (B), and IgG (C) values according to the type of kidney disease. Protein concentrations are expressed as the mean ± sem. **p<0.01, ***p<0.001 compared to glomerular disease using Student's T test; the Mann-Whitney test was used for the glomerular vs. comparison with non-specific lesions. Glom: glomerular diseases; Tub-Int: tubular and/or interstitial diseases; Vasc: vascular diseases; Non-spe: non-specific.

