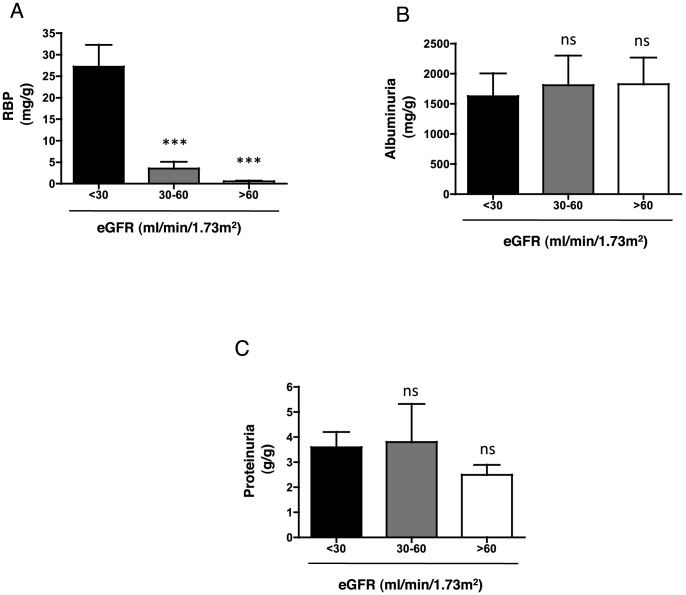
Figure 3. Distribution of proteinuria according to the estimated glomerular filtration rate.
A, B, C. Histogram showing Alb (A), RBP (B), and total proteinuria (C) values according to the level of eGFR. Protein concentrations are expressed as the mean ± sem. **p<0.01, ***p<0.001 compared to eGFR <30 ml/min, using Student's T test.

