
Figure 5. Correlation between proteinuria and the extent of interstitial fibrosis.
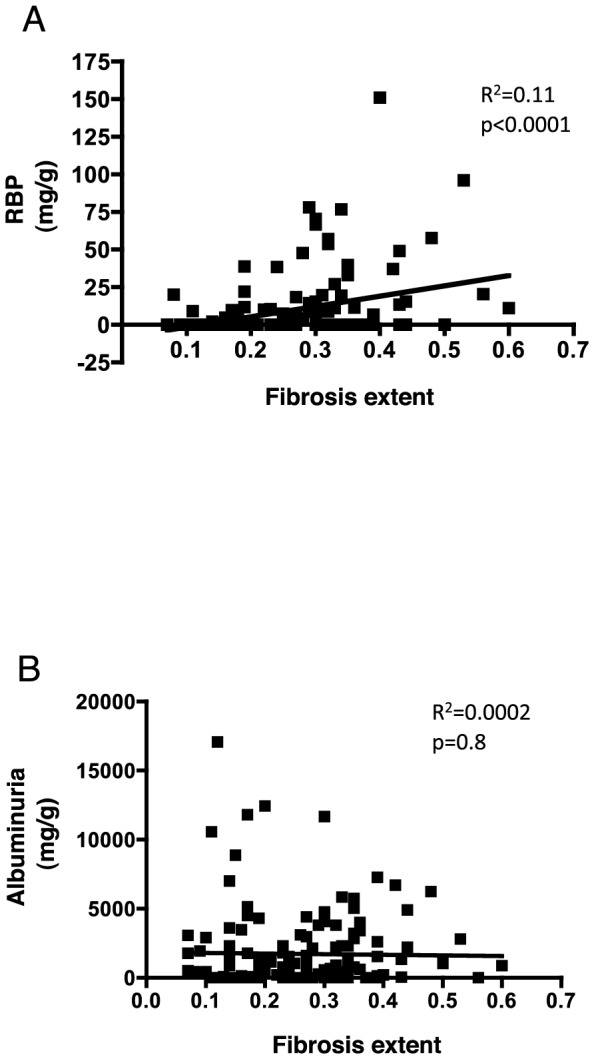
A, B. Best-fit slope of the linear regression between RBP (A) and Alb (B) and extent of fibrosis extent.
Official websites use .gov
A
.gov website belongs to an official
government organization in the United States.
Secure .gov websites use HTTPS
A lock (
) or https:// means you've safely
connected to the .gov website. Share sensitive
information only on official, secure websites.
A, B. Best-fit slope of the linear regression between RBP (A) and Alb (B) and extent of fibrosis extent.