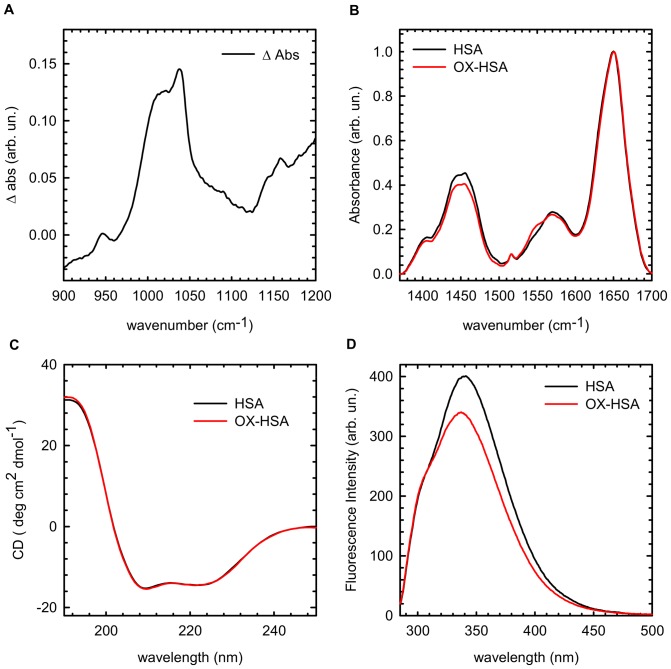
Figure 1. Spectroscopic Analysis of structural and conformational changes induced in human serum albumin by oxidation.
(A) Difference FTIR absorption spectrum in the region 900–1200 cm−1. Samples were prepared in KBr pellet 5% w/w and signal of the HSA sample were subtracted to the OX-HSA in the same conditions; (B) FTIR spectra in the Amide region (1300–1700 cm−1) of HSA (black line) and OX-HSA (red line), 15 mg/ml in D2O. Data are normalized at Amide I' peak; (C) Far-UV CD spectrum of HSA (black line) and OX-HSA (red line) 0.5 mg/ml K-phosphate buffer at pH 7.4 at room temperature; (D) Intrinsic fluorescence spectra of HSA (black line) and OX-HSA (red line) 0.5 mg/ml K-phosphate buffer at pH 7.4 at room temperature. The excitation wavelength was 280 nm.

