
Figure 2. ANS titration curves.
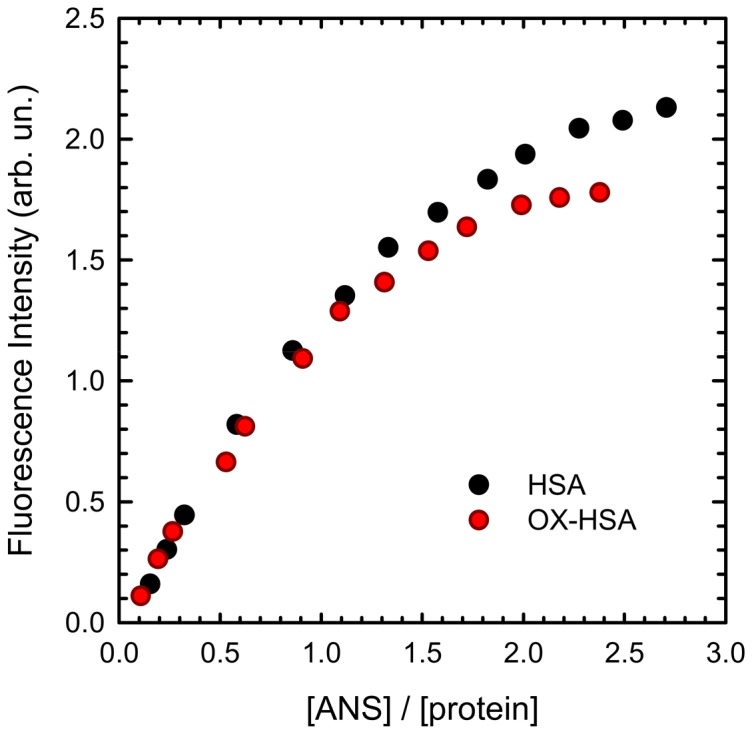
Integrated intensity of ANS emission as a function of molar ratio [ANS]/[protein] for HSA (black) and OX-HSA (red) in the range [ANS]/[protein] = 0.1–2.8. ANS fluorescence was measured at room temperature using an excitation wavelength λexc = 380 nm in HSA and OX-HSA samples 0.5 mg/ml in K-phosphate buffer 0.1 M at pH 7.4