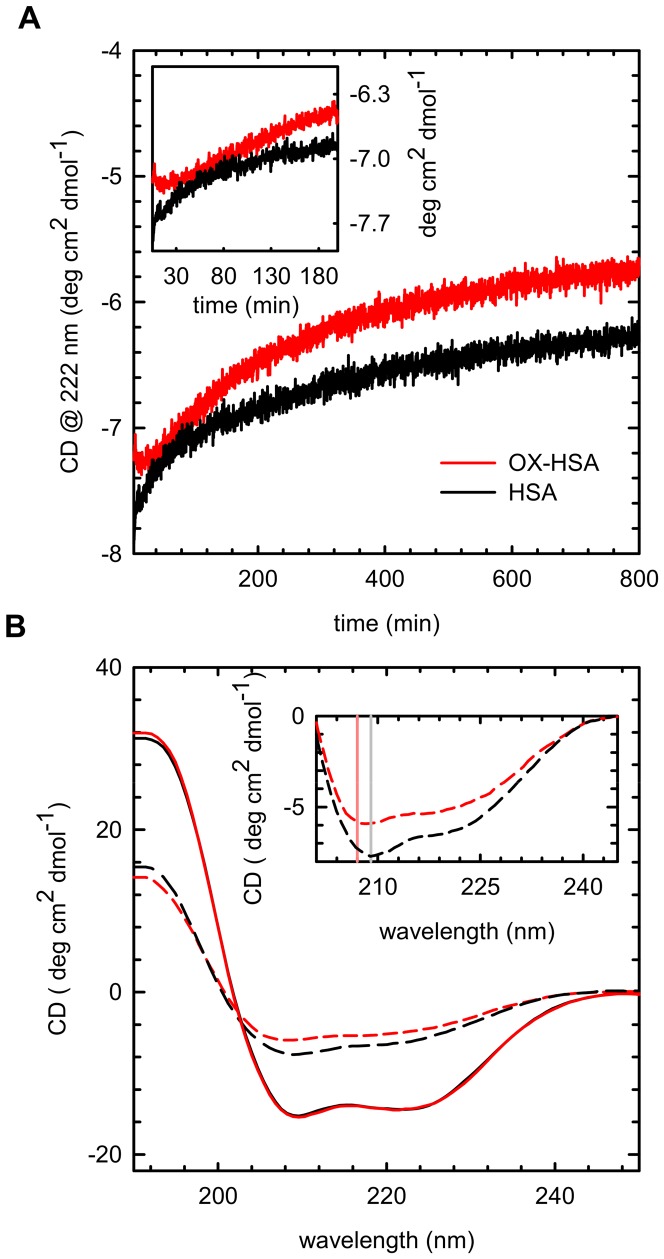
Figure 7. Secondary structure changes.
(A) Temporal evolution of CD signal measured at 222 for HSA (Black line) and OX-HSA (red line) sample 0.5 mg/ml in phosphate buffer 0.1 M at pH 7.4 incubated at 70°C for 800 minutes. Inset: magnification of the early stages (B) Far-UV CD spectra at room temperature of freshly prepared HSA (solid black line) and OX-HSA (solid red line) sample and of the same samples of HSA (dashed black line) and OX-HSA (dashed red line) after 800 minutes of incubation at 70°C. Inset: magnification of significant differences in the spectra. Solid lines at 207 (red) and 209 (grey) nm are guides for eyes.

