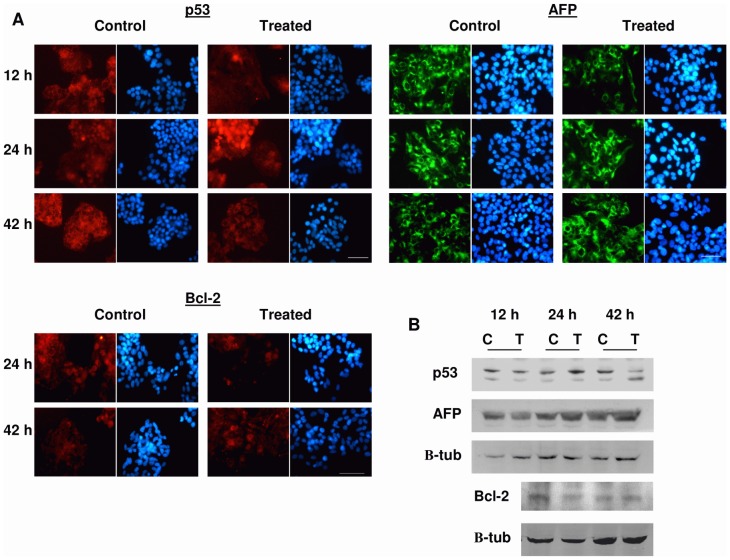
Figure 3. Immunofluorescence and immunoblots for p53, AFP and Bcl-2 expression.
(A) Immunofluorescence for p53, and AFP expression during treatment (12 h) and for p53, AFP and Bcl-2 after treatment (24 and 42 h). Samples were processed as described in Materials and Methods. Staining: Alexa Red for p53 and Bcl-2, Alexa Green for AFP, Hoechst 33342 for DNA. Bar = 50 µm. (B) Representative Blot of p53 and AFP expression during treatment (12 h) and of p53, AFP and Bcl-2 after treatment (24 and 42 h). C = control; T = treated with 50 µA/mm2; p53 and Bcl-2: 100 µg protein/lane; AFP: 30 µg protein/lane. Immunoblot was processed as described in Materials and Methods. β-tubulin was used as loading control.

