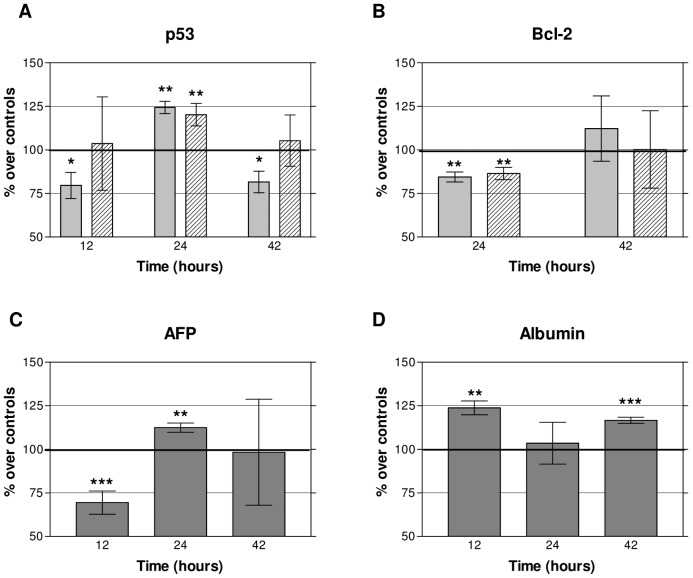
Figure 4. Expression of p53, Bcl-2, AFP and albumin in HepG2 cells.
(A) Mean ± SEM values of immunofluorescence and densitometry of Western Blotting for p53 during (12 h) and after treatment (24 and 42 h). Dotted bars: immunofluorescence labeling; hatched bars: blot densitometry. A minimum of three replicates for experimental technique and experimental interval were conducted. Between three and five dishes per experimental group and replicate. (B) Mean ± SEM values of immunofluorescence and densitometry of Western Blotting for Bcl-2 after treatment (24 and 42 h). Same procedures and notations as in A. (C) AFP Western Blotting densitometry during (12 h) and after treatment (24 and 42 h). Means ± SEM of a minimum of three replicates per time interval; five treated samples and five controls per replicate. All Western Blotting values are given as the ratio protein/β-tubulin and expressed as percents over the corresponding controls. D) Albumin nephelometry. Albumin concentration (ng/living cell) released into the culture medium by the cells during (12 h) and after treatment (24 and 42 h). Means ± SEM of three replicates per time interval; two treated samples and two controls per replicate. Asterisks identify statistical significance referring to the corresponding control group; *: 0.01<P<0.05, **: 0.001≤P≤0.01, ***: p<0.001 (Student's t-test)

