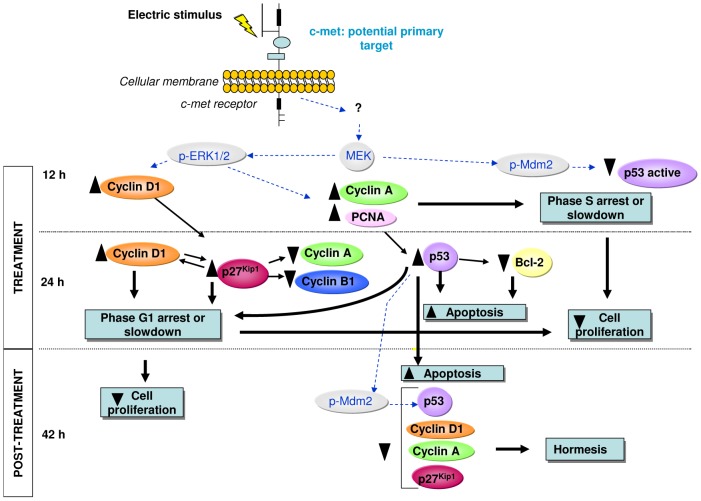
Figure 5. Schematic representation of the cascade of events triggered by CRET stimulation.
Sequential progression of the response during (12 h) and after treatment (24 and 42 h). Blue dotted arrows: proposed action pathways. Black arrows: confirmed pathways; ▴: statistically significant increases; ▾ statistically significant decreases (see also Table 1).

