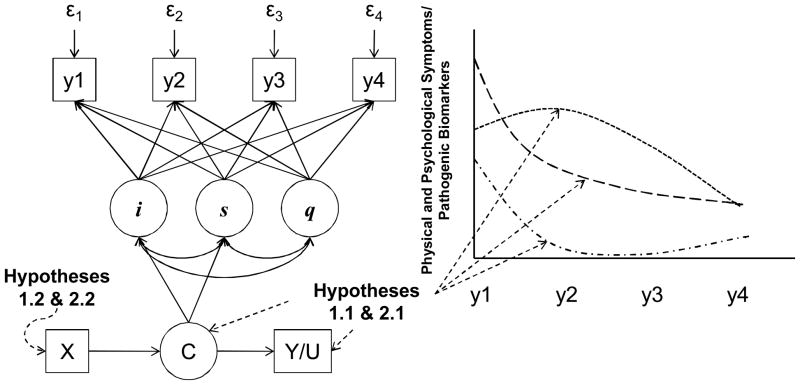
Figure 2. Growth Mixture Modeling: Specific Aims 1 and 2.
Following an identify, associate, and predict approach to growth mixture modeling, this example model includes growth curves for a symptoms/biomarkers (y) as observed at 4 time points, with intercepts (i) slopes (s), a non-linear pattern of change (q) a categorical variable indicating “most likely” trajectory (C), outcomes that are associated with trajectory membership such as the continuous outcome of health-related quality of life (Y) or categorical outcome such as hospitalization (U) (relevant to hypotheses 1.1 and 2.1), and predictors of trajectory membership (X) (relevant to hypotheses 1.2 and 2.2). This model only contains change in one symptom/biomarker for economy of presentation; growth mixture modeling is quite flexible and can accommodate change in many factors concomitantly.

