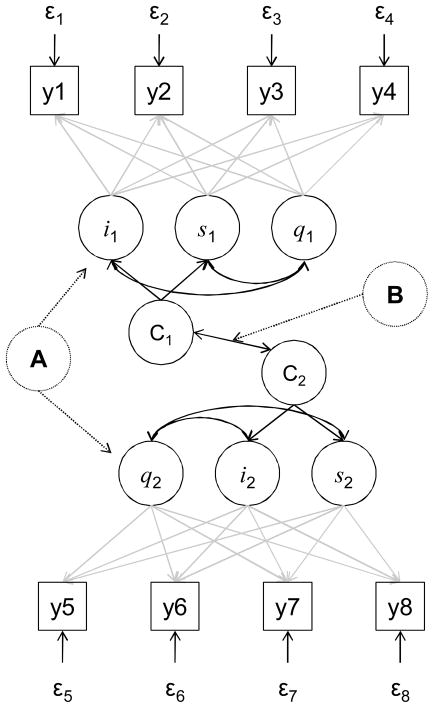
Figure 3. Parallel Process and Cross Classification Modeling: Specific Aim 3.
This example model includes growth curves for two continuous measures (y) as observed at 4 time points, each with an intercept (i) slope (s), non-linear pattern of change (q) and a categorical variable indicating “most likely” common and distinct trajectory (C). Parallel process modeling (Figure 3-A) entails quantifying repeated measures congruence between changes in the two measures over time using fit statistics to determine how much change in one variable is explained by change in the other (χ2, comparative fit index, Tucker-Lewis index, and root mean square error of approximation, as well as parameter estimates). Cross classification modeling (Figure 3-B) involves comparing distinct trajectories of change in one variable (C1) compared with distinct trajectories of the other (C2). For example, the “most likely” trajectory membership based on change in a symptom and the “most likely” trajectory membership based on change in a serum biomarker are compared using odds ratios or χ2 tests.

