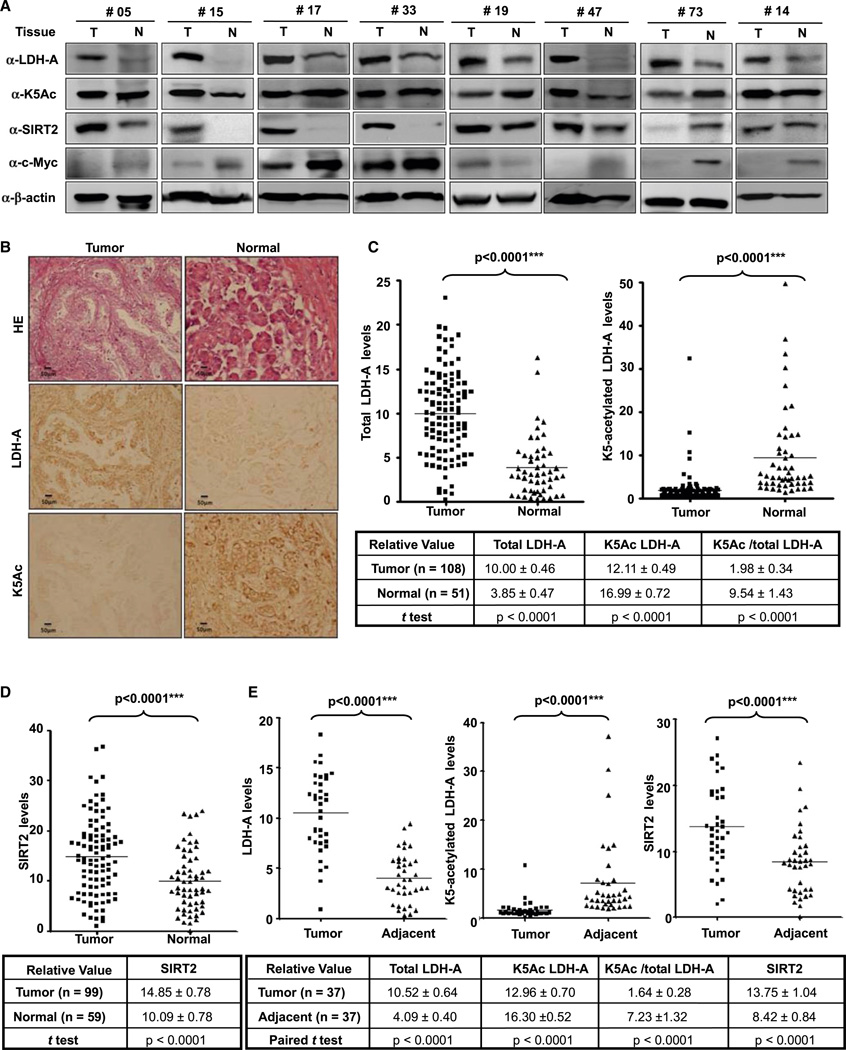
Figure 6. K5-Acetylation of LDH-A Is Downregulated in Pancreatic Cancer.
(A) Total LDH-A and SIRT2 protein are increased and K5-acetylated LDH-A decreased in pancreatic cancer tissues compared to adjacent tissues. The levels of LDH-A protein, K5 acetylation, SIRT2, and c-Myc in 19 pairs of pancreatic cancer and adjacent normal tissues were analyzed by western blotting. Eight pairs that exhibited clear inverse correlation between K5-acetylated and total LDH-A and positive correlation between SIRT2 and total LDH-A are shown. See also Figure S6A for the complete western blotting of the other 11 pairs.
(B and C) Immunohistochemical stainings of K5-acetylated and total LDH-A proteins in tumor and adjacent normal tissues. One example is shown in (B) and the statistical analysis of all samples is shown in (C). Scale bars are 50 µm. The intensities of the total (left panel) and K5-acetylated (right panel) LDH-A proteins were quantified using the Motic Images Advanced software, followed by statistical analysis. A total of 108 pancreatic cancer tissues and 51 adjacent normal pancreatic tissues were analyzed. The mean value of multiple samples and standard deviation are presented.
(D) Immunohistochemical staining of SIRT2 proteins in tumor and adjacent normal pancreatic cancer tissues. The statistical analysis of 99 tumor and 59 normal samples is shown. The intensities of SIRT2 proteins were quantified using the Motic Images Advanced software, followed by statistical analysis. The mean value of multiple samples and standard deviation is presented.
(E) LDH-A protein levels show negative correlation with K5 acetylation, and positive correlation with SIRT2 protein in pancreatic tumors. Among the 39 paired pancreatic cancer tissues that had been examined for all three signals (LDH-A, K5Ac, and SIRT2), 37 cases showed high LDH-A protein levels in tumors compared with adjacent tissues. These tumors also exhibited increased SIRT2 and decreased acetylation at K5. See also Figure S6.

