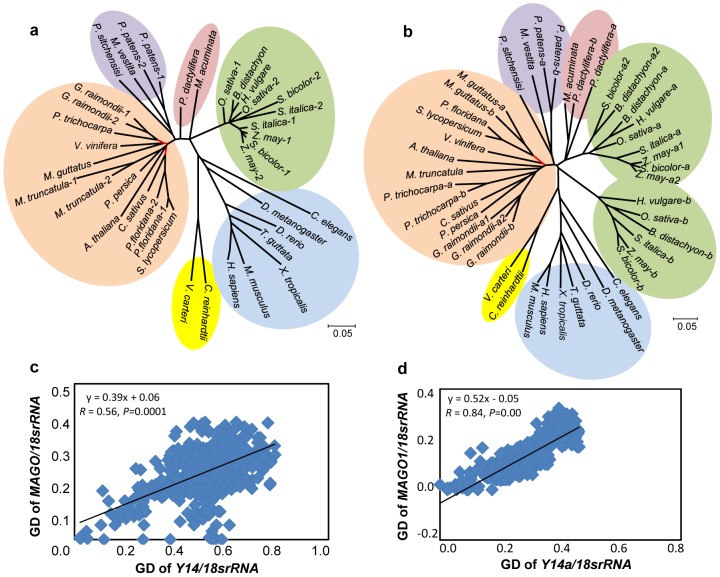
Figure 2. Tol-MirrorTree analyses reveal the co-evolution of the MAGO and Y14 families at protein levels.
(a) Phylogenetic tree of the MAGO protein family. (b) Phylogenetic tree of the Y14 family. These ML trees include sequences from algae (yellow), animals (blue), dicots (orange), monocots: grass (green) and others (pink), and gymnosperm and moss (purple). The red lines represent the branches with less than 50% bootstrap in the trees. (c–d) Evaluation of tree similarity. Genetic distances (GD) between MAGO and Y14 sequences were corrected by 18s rRNA to avoid a contribution of speciation. (c) Similarity of the ML trees with the whole set of sequences shown in a and b. (d) Tree similarity when single sequence for each family in one organism. Similarity evaluation of the ML trees with an inclusion of MAGO1 and Y14a sequences is presented in (d). Pearson correlation coefficient is 0.61 (P = 0.00) when MAGO2 and Y14b sequences were included.

