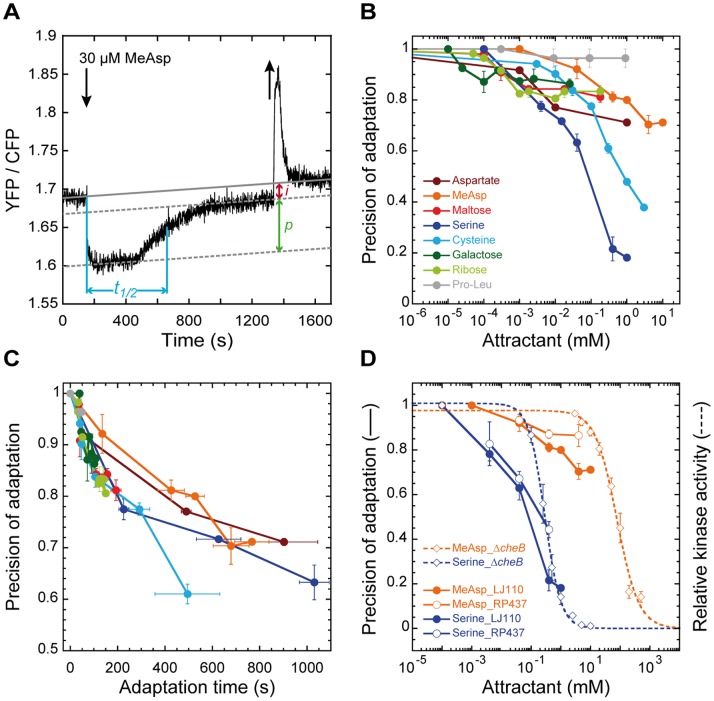
Figure 1. Precision of adaptation in wild-type cells.
(A) Example FRET measurement of the pathway response. Cells expressing the CheY-YFP/CheZ-CFP FRET pair, a reporter for kinase activity, were stimulated by step-like addition (down arrow) and subsequent removal (up arrow) of 30 µM MeAsp, a nearly saturating stimulus. Changes in kinase activity in response to addition of attractant were used to determine adaptation time (t1/2), defined as the time required to regain 50% of the initial loss in activity, and imprecision of adaptation (i), defined as the difference in the YFP/CFP ratio between cells adapted to buffer (interpolated grey solid line) and to a given attractant concentration (parallel dotted line below). Precision of adaptation (p), the fraction of kinase activity recovered in the presence of ambient ligand, was then obtained as 1−i, with 1 being the maximum possible precision (see Materials and Methods for details). The upward drift of the baseline is due to faster photobleaching of CFP compared to YFP. (B) Dependence of precision of adaptation on attractant concentration in wild-type strain SN1 [LJ110 Δ(cheY cheZ)]. Values were normalized to the response of buffer-adapted cells to a saturating ligand concentration. Some data in (B) were replotted from [14]. Error bars here and throughout indicate standard errors for multiple measurements. (C) Dependence of precision of adaptation on adaptation time. (D) Comparison of precision of adaptation for MeAsp (orange symbols) and serine (blue symbols) in strains SN1 (closed circles) and VS104 [RP437 Δ(cheY cheZ), open circles] with dose-response curves of cheB strain VS124 [RP437 Δ(cheB cheY cheZ)] for steps of MeAsp or serine (open diamonds). Relative kinase activity was calculated as described previously [16], [17] and fitted by a multisite Hill equation [17].

