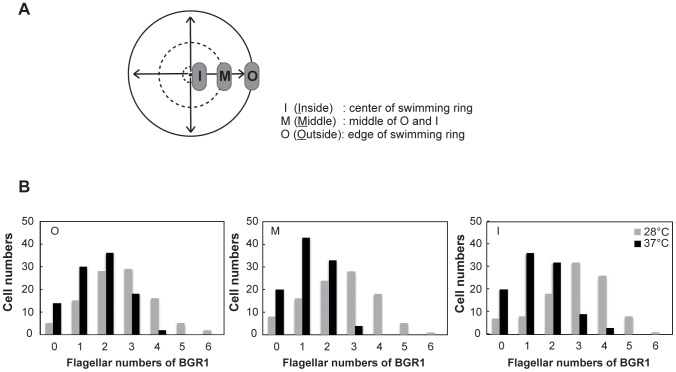
Figure 1. Flagellar number of wild-type strain BGR1 at 28°C and 37°C.
A. Schematic diagram showing the three divisions of the motility ring on 0.3% soft agar plates. Dotted and solid lines indicate the swimming regions, while the arrows indicate the direction of movement, of motile cells. Outside (O: edge of swimming ring), inside (I: center of swimming ring), and middle (M: middle of O and I) indicate the regions of the swim assay plates from which bacterial samples were taken. B. Distribution of BGR1 wild-type cells that had different numbers of flagella that were sampled from the O, M, I regions of the swim assay plates at 28°C and 37°C. Cells were counted based on TEM images (n = 100).

