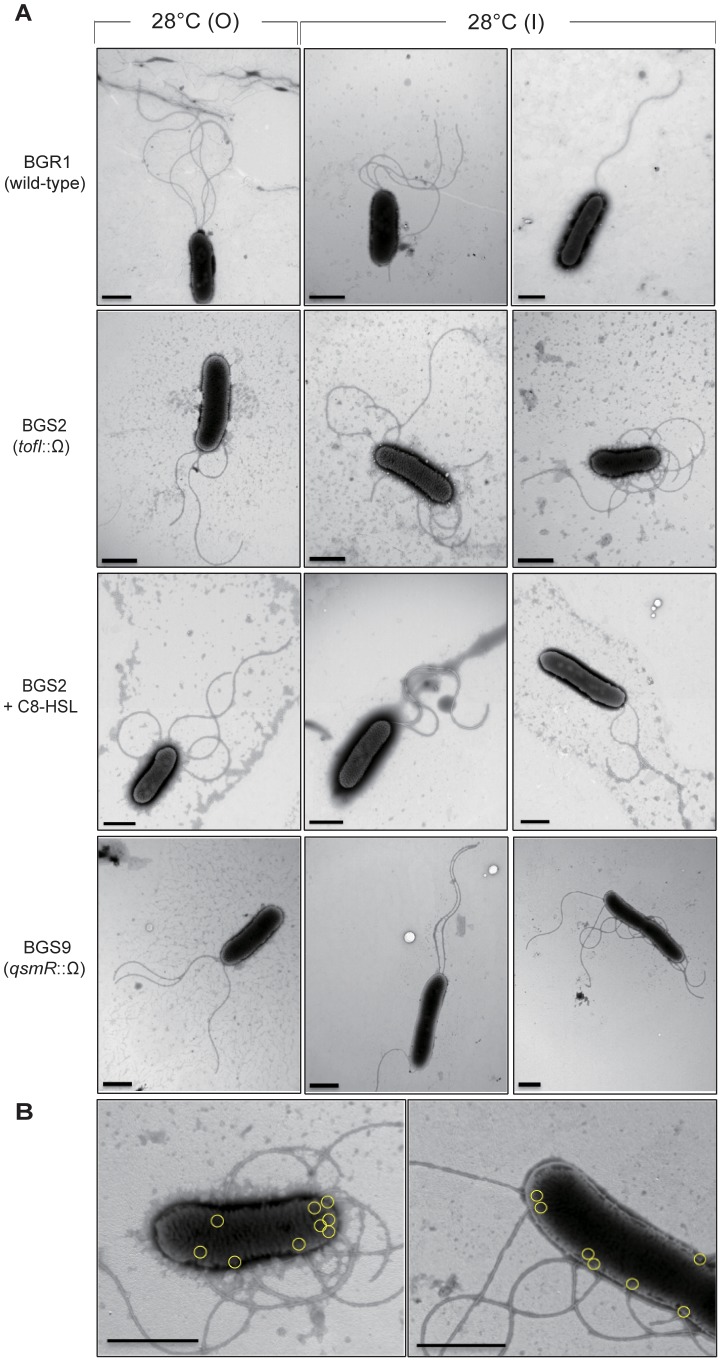
Figure 4. Flagellar morphology of the wild-type BGR1 and the QS mutants.
A. TEM images showing polar and nonpolar flagellar formation in the wild-type BGR1, the tofI mutant BGS2, and the tofI mutant BGS2 cells supplemented with 1 µM of C8-HSL, and the qsmR mutant BGS9 cells taken from the O and I regions of the swim assay plates after culture for 20 h at 28°C. B. Magnified TEM images of nonpolar flagella in the tofI mutant BGS2 cells and the qsmR mutant BGS9 cells. Yellow circles indicate the sites of flagellar formation. Bars = 1 µm.

