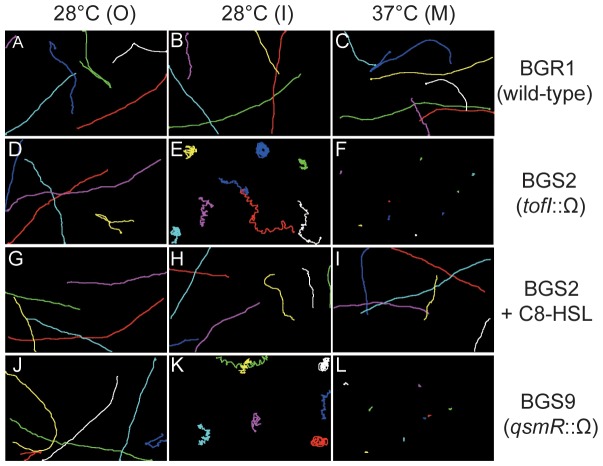
Figure 5. Tracking the movement of individual cells of the wild-type BGR1 and the QS mutants.
Cell samples were taken from the O, I, and M regions of 0.3% soft agar plates for 20 h at 28°C and 37°C. Individual cell movement of the wild-type BGR1, the tofI mutant BGS2, and the tofI mutant BGS2 cells supplemented with 1 µM of C8-HSL, and the qsmR mutant BGS9 cells was determined by the manual tracking plug-in of ImageJ program. Each colored line shows the path of a different cell over a 2-s period. Swimming movement of individual BGR1 cells (A–C) Swimming movement of individual BGS2 cells (D–F). Swimming movement of individual BGS2 cells supplemented with 1 µM of C8-HSL (G–I). Swimming movement of individual BGS9 mutant cells (J–L).

