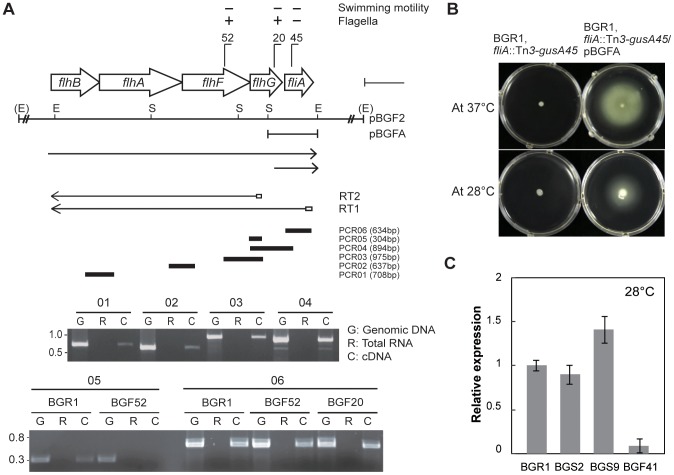
Figure 6. Genetic organization of flhBAFG and fliA genes, and flhF gene expression at 28°C.
A. Genetic organization and transcriptional units of flhBAFG and fliA, with arrows showing the direction of transcription. Recognition sites for EcoRI and StuI are indicated by E and S, respectively. Vertical bars on the map denote the positions and orientation of the Tn3-gusA insertion. The two lines with arrowheads beneath the restriction enzyme map indicate the direction and extent of transcription. cDNA synthesized by reverse transcriptase with primers RT1 and RT2 was analyzed by PCR. Thick bars indicate the six expected PCR products, which were verified by electrophoresis on 1.5% agarose gel. B. Photographs of swim assay plates showing the swimming motility of the BGR1 mutant fliA::Tn3-gusA45 and complementation with pBGFA carrying the fliA gene at 28°C and 37°C. C. Expression levels of the flhF gene in the wild-type BGR1, the tofI mutant BGS2, and the qsmR mutant BGS9, and the flhC mutant BGF41 at 28°C, based on qRT-PCR analysis. Vertical lines indicate the standard deviations of three independent experiments.

