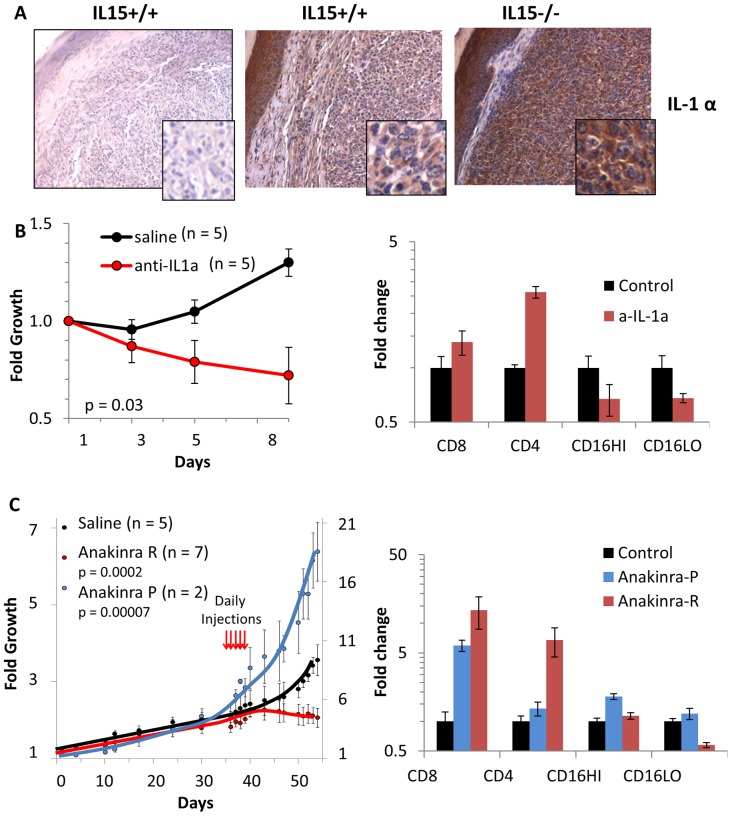
Figure 4. Loss of IL-15 exposes IL-1α as a regulator of tumor growth and potential therapeutic target.
A) Images of IL-1α IHC in IL-15+/+ (middle) and IL-15−/− (right) TAX-LUC tumor sections compared to control lacking primary IL-1α antibody (left). B) The effect of anti-IL-1α antibodies (red curve, n = 5) on tumor growth compared to saline (black curve, n = 5) in IL-15+/+ TAX-LUC mice over the course of 1 week. Error bars represent standard deviation of tumor growth, and p values represent 2-tailed, paired Student’s T Tests. The bar graph (right) represents FACS data obtained from anti-IL-1a treated tumors (red bars) or control tumors (black bars) at necropsy showing the abundance of CD8+, CD4+, CD16/32HI, and CD16/32LO cells present in the tumor at the experimental endpoint. Y axis is log scale and error bars represent standard deviation. C) The effect of Anakinra on tumor growth compared to saline. In 7 of 9 mice Anakinra resulted in repression of tumor growth (Anakinra R, red line), while in 2 of 9 mice Anakinra resulted in promotion of tumor growth (Anakinra P, blue line). Graph is double-Y to accommodate the scale differences between Anakinra R and control (left scale) versus Anakinra P (right scale). Red arrows indicate the time points of daily Anakinra injections, error bars represent standard deviations and p values represent 2-tailed, paired Student’s T Tests. The bar graph (right) represents FACS data obtained from Anakinra treated tumors or control tumors at necropsy showing the abundance of CD8+, CD4+, CD16/32HI, and CD16/32LO cells present in the tumor at the experimental endpoint. Y axis is log scale and error bars represent standard deviation.

