
Fig. 3.
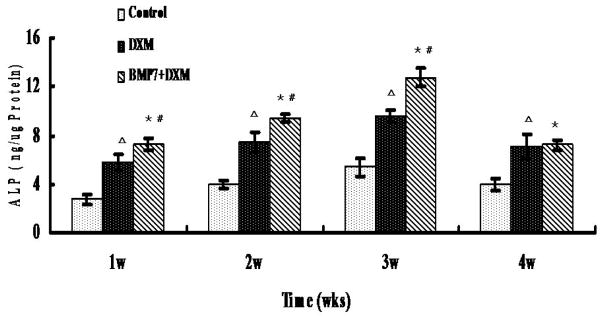
ALP activity quantification of DPSCs cultured on NF-PLLA scaffolds in different media. The bars represent means ± SD (n = 3). “BMP-7 + DXM” group compared to control group: *p<0.05; “BMP-7 + DXM” group compared to “DXM” group: #p<0.05; “DXM” group compared to control group: Δp<0.05.