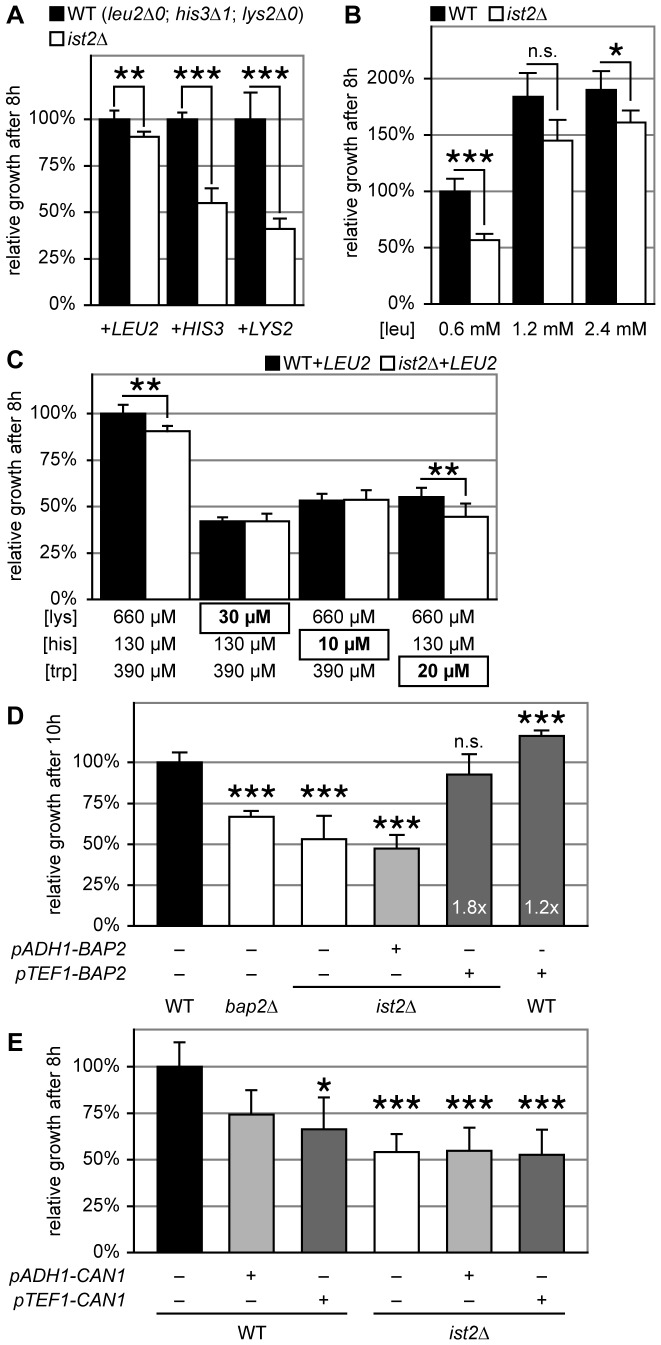
Figure 4. Leucine uptake is impaired in ist2Δ.
(A) Relative growth of WT (black) and ist2Δ (white) strains transformed with CEN plasmids encoding the LEU2, HIS3 or LYS2 gene. Pre-cultures grown in HC-leu, HC-his or HC-lys media for 18 hours were diluted to 0.1 OD600 into fresh HC media and grown for 8 hours. OD600 of transformed ist2Δ strains were normalized to the respective WT strains. Error bars indicate s.d.m. (n ≥6). (B) Relative growth of WT and ist2Δ strains in HC media with the indicated leucine concentration. Note that the leu concentration of standard HC medium is 0.6 mM. Pre-cultures grown in HC medium for 18 hours were diluted to 0.1 OD600 into fresh media and grown for 8 hours. OD600 were normalized to WT grown in standard HC media. Error bars indicate s.d.m. (n = 6). (C) Relative growth of WT and ist2Δ strains transformed with LEU2-encoding CEN plasmids at limiting lysine (30 µM), histidine (10 µM) and tryptophane (20 µM) concentrations. Pre-cultures grown in HC-leu for 18 hours were diluted to 0.1 OD600 into fresh HC-leu media with the indicated lysine, histidine and tryptophane concentrations. OD600 were normalized to WT grown in standard HC medium. Error bars indicate s.d.m. (n ≥6). (D) Relative growth of WT, bap2Δ and ist2Δ strains transformed with CEN plasmids encoding BAP2 under control of the pADH1 (light grey) or pTEF1 (dark grey) promoters or empty plasmids p416. Pre-cultures grown in HC-ura for 18 hours were diluted to 0.1 OD600 into fresh HC media and OD600 was measured after 10 hours. OD600 was normalized to WT transformed with empty plasmid. White numbers at the base of dark grey bars indicate fold increase compared to respective strains transformed with empty plasmids. Error bars indicate s.d.m. (n ≥3). (E) CAN1 under control of pADH1 and pTEF1 promoters or empty vectors were expressed in WT and ist2Δ cells from CEN plasmids. Cells were grown to the end of log phase, diluted to 0.1 OD600 into fresh medium and OD600 was measured after 8 hours. OD600 was normalized to WT transformed with empty plasmid (black). Error bars indicate s.d.m. (n = 6). Significance (unpaired, two-tailed student’s t-test) of p<0.01, p<0.005 and p<0.001 is indicated by single, double and triple asterisks; n.s. indicates non-significant difference (p>0.01).

