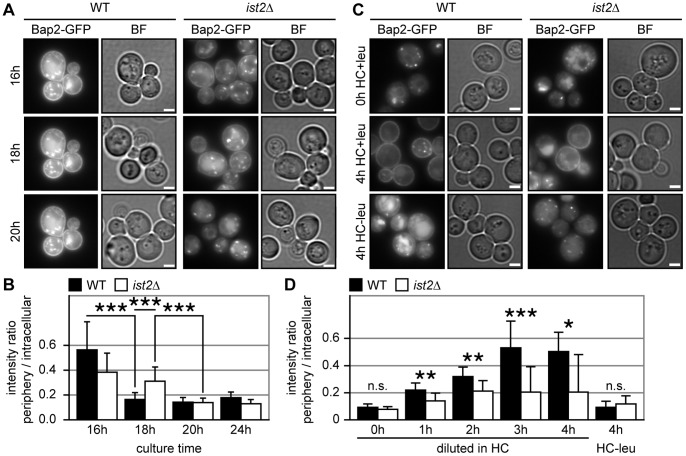
Figure 5. PM trafficking of Bap2 is impaired in ist2Δ cells.
(A and C) Representative green channel (Bap2-GFP) and bright field (BF) images of WT and ist2Δ cells expressing genomically tagged Bap2-GFP. Cells were inoculated to 0.2 OD600 in HC media and grown for 16 to 20 hours (A). After 24 hours (indicated as 0 h HC+leu) cells were diluted 1∶20 into fresh HC media containing (4 h HC+leu) or lacking (4 h HC-leu) leucine and grown for 4 hours. Scale bars correspond to 2 µm. For quantification of the intensity ratio between peripheral and intracellular fluorescence the mean intensity of a ring-like peripheral area was divided by the mean intensity of the intracellular area (B and D). The quantification of the experiment shown in A includes an additional 24 hours time point (B). The quantification of the experiment shown in C includes additional time points 1 to 3 hours after dilution in HC-leu media (D). Error bars indicate s.d.m. (n = 15). Significance (unpaired, two-tailed student’s t-test) of p<0.01, p<0.005 and p<0.001 is indicated by single, double and triple asterisks; n.s. indicates non-significant difference (p>0.01).

