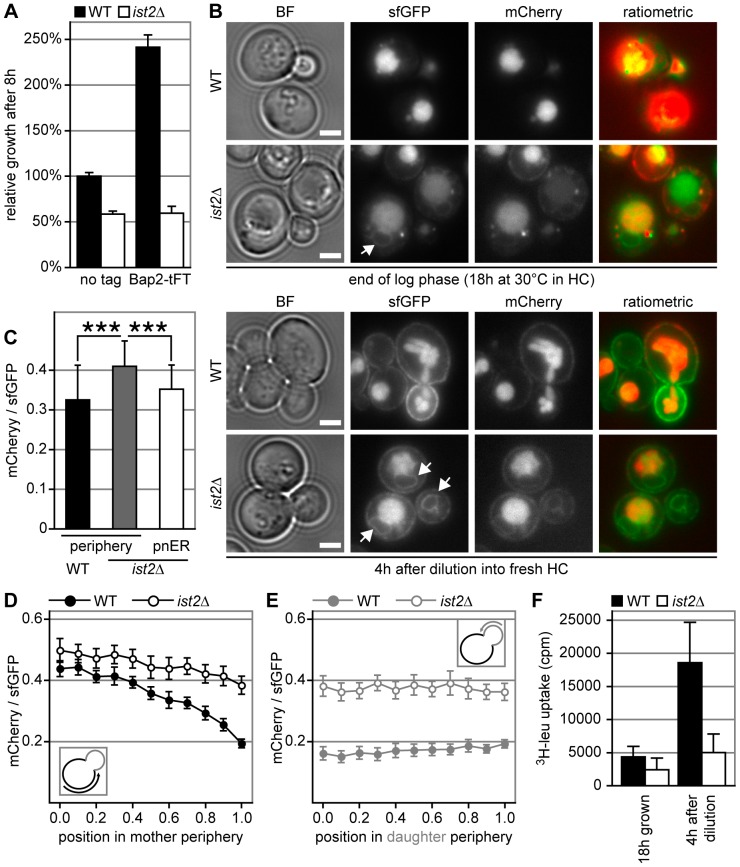
Figure 6. ER exit of newly synthesized Bap2 is delayed in ist2Δ cells.
(A) Relative growth of WT (black) and ist2Δ (white) cells expressing endogenous Bap2 (no tag) or Bap2-tFT. Cells were grown in HC media for 18 hours, diluted to 0.1 OD600 into fresh medium and grown for 8 hours. OD600 was normalized to WT expressing untagged Bap2. Error bars indicate s.d.m. (n = 6 for untagged and n = 15 for tFT-tagged cells). (B) Representative images of Bap2-tFT expressed in WT and ist2Δ cells. Bright field (BF), green channel (sfGFP), red channel (mCherry) and ratiometric images are shown after 18 hours growth in HC media or 4 hours after dilution into fresh HC media. Arrows in sfGFP images indicate perinuclear ER. Scale bars in BF images correspond to 2 µm. (C) mCherry/sfGFP intensity ratios of the periphery in WT and ist2Δ cells and of perinuclear ER in ist2Δ. Error bars indicate s.d.m. (n = 40; 10 cells each from 4 images taken with identical settings. Single cell values correspond to mean intensity of three randomly chosen areas within the respective membrane). (D and E) Distribution of the mCherry/sfGFP intensity ratio for Bap2-tFT in the periphery of WT (filled circles) and ist2Δ (open circles) mother (D) and daughter (E) cells. Error bars indicate s.e.m. (n ≥17). (F) Uptake of 3H-leucine in WT and ist2Δ cells expressing genomically tagged Bap2-tFT and LEU2 from a plasmid. Cells were grown for 18 hours in HC media without leucine followed by dilution into HC media containing leucine.

