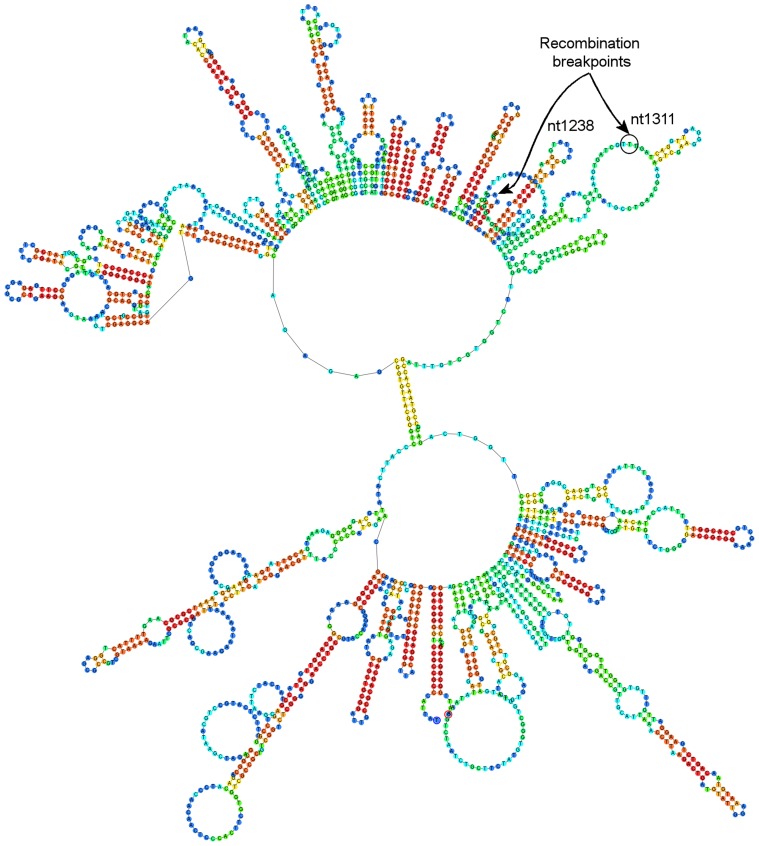
Figure 3. DNA folds analysis for demonstrating loop-like DNA structure within recombination breakpoint locations.
Predicted DNA fold analysis showing recombination breakpoint locations within loop structures in the BFDV genome (12-0827-201213, GenBank accession: KC693651) [22] using tools available in Geneious 6.1.6. The first recombination breakpoint location at thymidine nt location 1311 (P≤0.001) as circled was a consistently predicted loop structure in all recombinant genomes (n = 15), a second recombination breakpoint location at 1238 (P≤0.05) is also shown (arrow) in a smaller loop structure. Colors of nucleotides represent base-pair probabilities (red = high, green = mid, blue = low).

