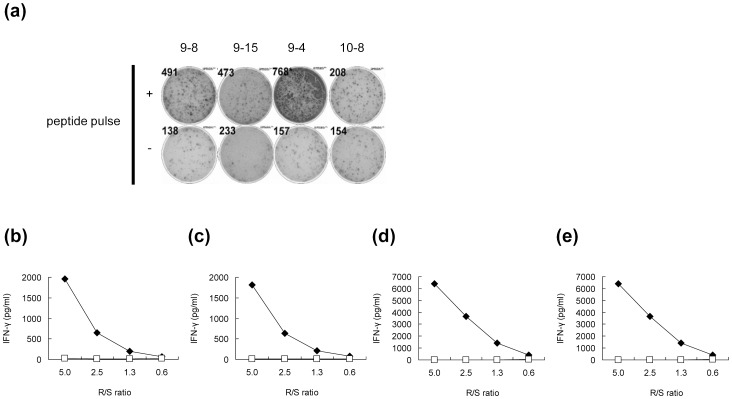
Figure 1. The IFN-γ production in response to the HIG2-9-8, HIG2-9-15, HIG2-9-4 or HIG2-10-8 peptide.
(a) The IFN-γ production from cells induced by the indicated peptide-pulsed DCs was examined by an ELISPOT assay using T2 cells. “+” indicates the wells in which cells were stimulated with T2 cells pulsed with the indicated peptide and “−” indicates the wells in which cells were stimulated with HIV peptide-pulsed T2 cells. The IFN-γ production from cells induced with HIG2-9-8 (b), HIG2-9-15 (c), HIG2-9-4 (d) or HIG2-10-8 (e) peptide stimulation after CTL expanding culture was examined by ELISA. Cells were stimulated with T2 cells pulsed with the corresponding peptide (closed diamonds) or HIV peptide (open squares) at the indicated responder/stimulator ratio (R/S ratio). Similar results were obtained from three independent experiments.

