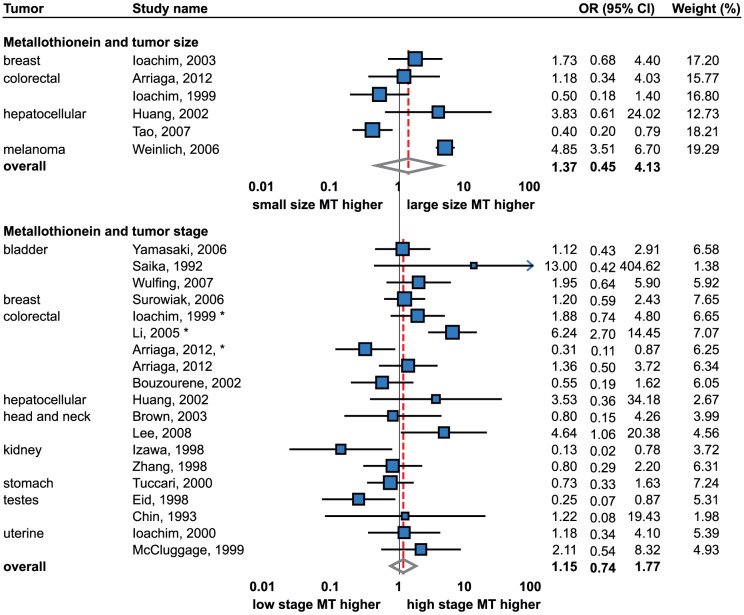
Figure 3. Forrest plot of studies reporting the association of metallothionein staining and tumor size and stage.
Random effects model used for both outcomes, Relative weight of individual studies displayed in %. * indicates studies using Dukes staging system. For more detailed results see Table 1 and 2. Sorted alphabetically by tumor types. Forrest plot displayed as odds ratio and 95% confidence intervals. Red dashed line indicates the result for all studies together. OR, odds ratio; CI, confidence interval.

