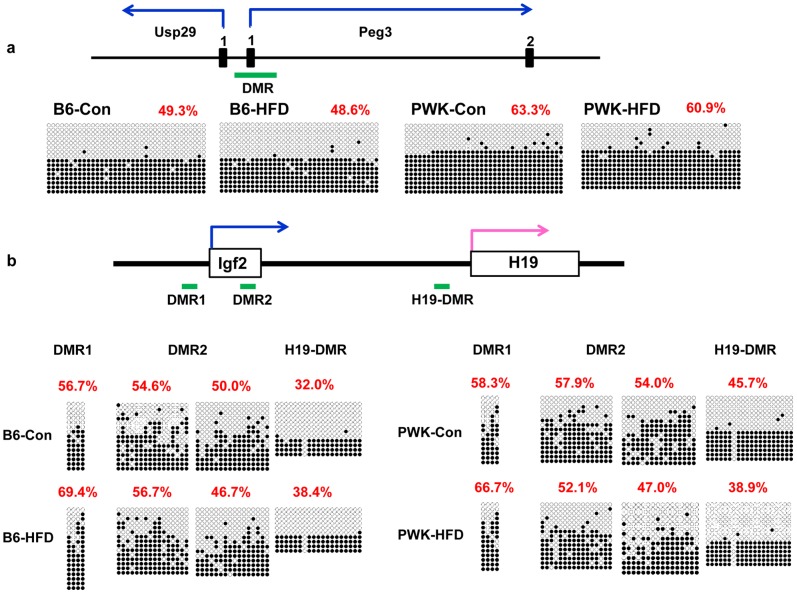
Figure 4. The DNA methylation status of the Peg3 and Igf2 DMR.
Analysis of Peg3 (a) and Igf2 (b) DMR were performed by bisulfite sequencing in B6 and PWK mice fed with control diet and HFD. Methylated and unmethylated CpG sites are indicated by closed and open circles, respectively. Percentages of methylated CpG sites are indicated in parentheses.

