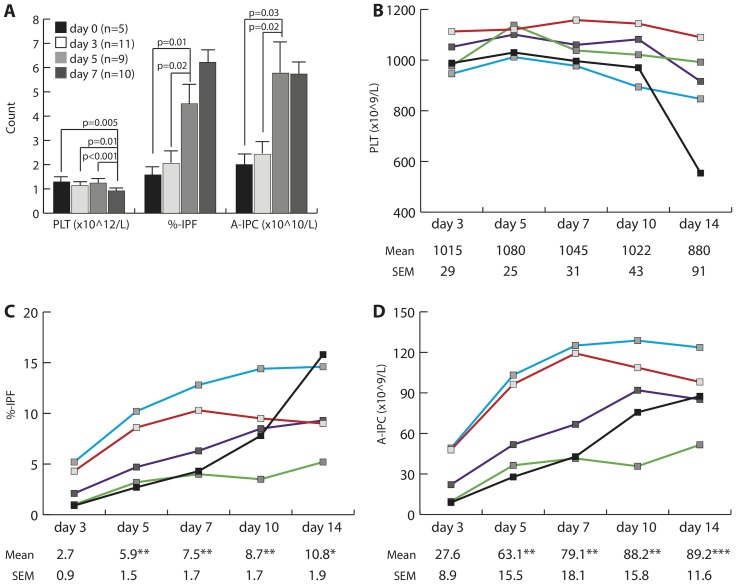
Figure 1. Steady increment of IPF and A-IPC in SDP during storage.
A, Platelet count, %-IPF and A-IPC of different SDP on day 0, 3, 5 and 7 post donation during storage; N represents the number of SDP specimens measured experimentally. B–D, Serial monitoring of platelet parameters in SDP during storage including platelet count (B), %-IPF (C) and A-IPC (D) on day 3, 5, 7, 10, and 14 (N = 5). * p<0.05, ** p<0.005, *** p<0.001 when compared to day 3. Both Mean and SEM are reported for each specimen per time point.

