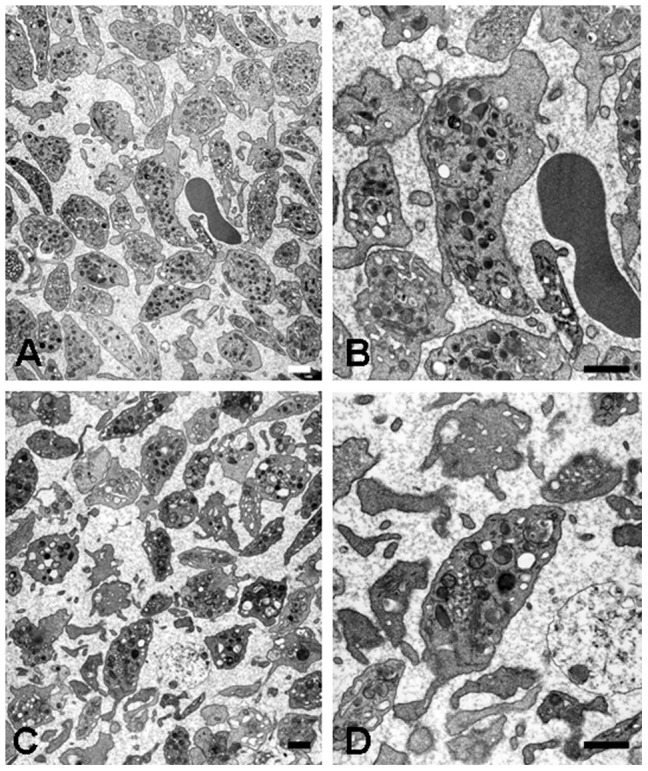
Figure 3. A–D, Transmission Electron Microscopy (TEM) analysis of platelet morphology in SDP units during prolonged storage.

A, Representative image of day 3 platelets and immature platelets in SDP; scale bar indicates 2 µm. B, Cross-sectional image of the immature platelet on day 3 as shown in Fig 3A with an adjacent erythrocyte for size comparison. The immature platelets contains glycogen, mitochondria, dense granules, alpha granules, and open canalicular system; scale bar indicates 500 nm. C, Representative image of the cross-sectional image of platelet in SDP on day 10; scale bar indicates 2 µm. D, Cross-sectional image of the immature platelet on day 10 as shown in Fig 3C; scale bar indicates 500 nm.
